My last blog (19 December 2016) looked at the supply of housing and whether the new housing market could be said to be acting rationally, even if that meant the number of houses being built was less than demand, as driven by population growth. This is more than just an interesting issue. The emphasis on finding a land supply (or capacity) blockage to the apparent under build of housing evident in Auckland may mean that other reasons are not considered. The focus on a planning related blockage suggests that once the blockage is identified and is unblocked, then house build rates will increase to match the rate of population growth. House price increases will ease and maybe come down. Simple. We even have an NPS that takes this line.
But is the housing market so straightforward? Will the industry respond in this way? If land supply and housing capacity is not the limiting factor, but is still thought to be the constraining factor because other factors are not considered, it is possible that there will be an ever increasing push for ‘more capacity’, but that capacity will not solve the problem; and could make things worse if that extra capacity is associated with a big liability for infrastructure provision and has the implications of some areas growing very quickly but other areas falling behind.
In my blog of 19 December 2016 I explored the potential for a number of factors that may mean that the new housing market does not respond quickly and comprehensively to population growth signals, especially spikes in population growth. For example, the growth of the Auckland region is being pushed by a high rate of net migration. Stats NZ estimate that Auckland grew by 44,400 people between June 2015 and June 2016. 70% of that growth was from net migration. The net migration figure is the difference between inward and outward permanent and long term migration. 12 months is the cut off point for ‘long term’ migration, so someone here for 18 months on a working holiday is counted as part of the growth of the population.
That population growth is often compared to the number of building permits for new dwellings issued. The BNZ in Feb 2016 provided a fairly typical analysis (1). Based on the same approach, about 10,000 permits were issued in the Auckland region last year (2015 to 2016), but demand was in excess of 14,500 dwellings, if the population growth is divided by 3. The difference between permits issued and demand, it is constantly claimed, is the result of lack of housing capacity arising from restrictive zonings and is the reason for the increasing house prices.
One of the reasons I listed for an undersupply of housing was uncertainty about the actual makeup of the population growth figures, specifically how much is long term permanent demand versus flows of temporary students and workers.
In this blog I want to look more closely at the issue of the makeup of the population growth and whether the new housing market is even looking at the demand that is flowing from this growth.
Firstly, a closer look at the recent population growth numbers. The actual socio-demographic makeup of the estimated growth in population of the Auckland region is quite hard to work out. Stats NZ provide an estimate of growth by age band. Those estimates show a very strong growth in the 15 to 39 year age band, when the period 2013 to 2016 is compared to 2010 to 2013.
Table 1: Age of Population growth, Auckland Region
Age bands
|
2010-2013
|
2013-2016
|
0-14 Years
|
2,100
|
6,700
|
15-39 Years
|
8,700
|
77,400
|
40-64 Years
|
22,900
|
16,500
|
65 Years and over
|
19,900
|
20,600
|
If the 15 to 39 year old age band is broken down further for the period 2013 to 2016, then the following figures are obtained. About half of the 77,000 figure is accounted for by the 25 to 29 year old age band.
Table 2: Growth in 15 to 39 year age bands - Auckland Region
Age Band
|
2013-16
|
15-19 Years
|
2,180
|
20-24 Years
|
18,130
|
25-29 Years
|
33,950
|
30-34 Years
|
17,140
|
35-39 Years
|
5,960
|
Total
|
77,360
|
It is a reasonable assumption that most of the increase in 25 to 29 year olds were migrants.
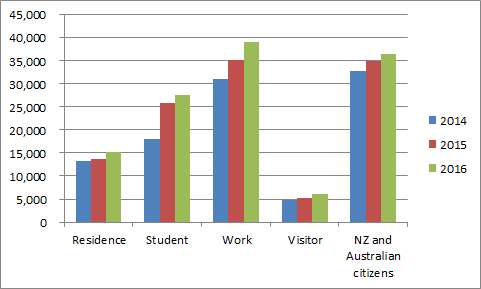
Taking a somewhat different tack, figures are available on the number of inward migrants by type of migrant, for the country as a whole. However this is not the same as the net gain outlined above, as the net gain in inwards minus outwards flows. There are no numbers on the outward flow. The biggest inward migrant type is work-related visas, with students also making up a large number.
Figure 1: Types of inward migrants
If we carry on a bit more, and look more closely at the work category, Immigration NZ lists the two top job categories of work visa over 2016 as ‘tour guide’ and ‘chef’. The length of stay for those with that type of work visa is not clear. The two job categories do not suggest permanent residents.
So how does the housing industry work out the housing demand from this picture? Students and short term workers add to housing demand in that they will live somewhere, but it may not be right to assume that they demand a 'normal' house. In my blog of 19 December 2016, I took at stab at saying that the true housing demand from this group may be only half of the number of additional people in the 15 to 39 year age band. The above figures tend to support such a hypothesis. Even people like the NZ Initiative recognise that not all migration leads to demand for housing (2) . If that is right, then demand and supply is much more in balance, and house prices must be being driven by something else.
The other answer to the miss-match may be that the new build industry doesn’t even look at the sector of the population that is growing the most.
A point that I did not mention in my previous blog is the contention that the new housing market is generally focused on what could be termed the upgrade market - existing homeowners wishing to upgrade. This point is most often raised in relation to affordable housing and housing for first home buyers. The most affordable housing tends to be houses that are 30 or 50 years old, not new houses. Most first home buyers buy an existing house. Increase the supply of new homes for existing homeowners who want to upgrade, and the older, currently occupied housing that they sell will ‘filter’ down to those below them on the housing ladder. Sounds reasonable.
A corollary to the upgrade market is the downgrade market. The retirement village industry often makes the same point: older folk shifting into a new retirement village free up the ‘family home’.
Constrain the supply of new homes, and filtering slows down:
Filtering is driven largely by upper-income people who leave their ageing homes for new ones. But if housing construction is restricted, there won’t be “enough” new homes, and some of those upper-income people will have to settle for older ones that might otherwise be occupied by people with less money.
Speed up the building of new homes for upgraders, and filtering should increase.
Does the proposition that most new homes are aimed at the upgrade market sound reasonable? Certainly, since the 1990s it feels like that the house building industry has been much less focused on the starter home market than it did during the 60s and 70s, and is much more focused on the upgrade market. Remember all those concerns during the 60s and 70s about cheap, group ‘starter’ housing developments and ‘nappy valleys ’ springing up across the countryside.
Is there any evidence about the number of new builds going to first home buyers? Westpac NZ (3) suggests that “market data shows that first home buyers have made up more than 21% of the Auckland market this year, up slightly on 2015. New builds require less deposit and are emerging as an option with first home buyers, up more than 2% this year on 2015, with Flatbush, Takanini and Silverdale popular locations. Meanwhile, the appetite for apartments has flatlined with fewer than 12% choosing that option”.
While helpful, the commentary doesn’t really distinguish between new builds and buying an existing house, for first home buyers. The only suburb in their commentary where new homes are listed as being brought by first home buyers is Hobsonville. Out of 517 first home sales noted across 6 suburbs in 2016, 60 were new homes in Hobsonville, or 11%. Of note, Hobsonville incorporates affordable housing options aimed at first timers.
Why the switch in focus for the new build sector from first homers to upgraders is worth a look in a future blog. Perhaps it is the baby boomers both ageing and getting more wealthy. What I want to look at in this blog is the implications of the focus on the ‘upgrade market’ and subsequent filtering of housing, for housing supply overall and housing capacity and zoning.
Three things occur to me:
Firstly, the focus of the new home sector on the upgrade market suggests that any attempt to compare housing supply with housing demand based on overall population growth to determine if there is a deficit or not of houses being built is going to be flawed. If the supply of new housing is driven by the upgrade market, then the supply will be based on the size and dynamics of that market, not overall population growth.
Secondly, following on from this, the concept could also mean that the new build sector does not keep up with population growth. To work, the demand from upgraders (and downgraders) needs to at least equal the overall demand for 'starter' housing. If not then there are fewer houses to filter down than houses needed. To be in balance, the demand for new builds needs to come from a large population base in the upgrade market and/or an on-going increase in household incomes in this bracket, relative to the new entrants to the housing market.
Thirdly, should most new home capacity be in more desirable, higher value areas, as these are presumably the most sought after upgrade areas - coastal areas, inner suburbs and perhaps out in the rural-residential horsey belt? As covered in previous blogs, most housing capacity in Auckland is in the middle ring suburbs and a lot of it involves apartments. This capacity may meet the needs of the upgrade market, but it may not.
To investigate these issues, I have started by looking at the demographics: the size of the upgrade market versus the size of the first home market. The following is a rough and ready analysis. Somebody clever than me can not doubt do a much better job.
If we begin by making a simple assumption that people aged 25 to 44 are the first home market and people 45 to 64 are the upgrade market, then we get the following market ‘segments’, based on Stats NZ data. The number is the number of usual residents in the two groups, for the Auckland Region. Not all of the 45 to 64 year old age group will be upgraders, while some will be new entrants (eg migrants), but generally they can be said to be part of the new home market.
Table 3: Size of first home buyers market versus upgraders - Auckland Region
Age bands
|
1996
|
2001
|
2006
|
2011
|
2016
|
25-44 (first home)
|
363,440
|
387,570
|
422,310
|
421,980
|
476,450
|
45-64 (upgraders)
|
345,420
|
378,790
|
421,900
|
422,280
|
442,940
|
The number in the two groups are largely the same through the period 1996 to 2011. By 2013, the size of the 24-44 age band has started to exceed the size of the 45-64 group.
If we look at the growth in the 25 to 44 age band over the 5 year periods, then we get the following data.
Table 4: Growth in 25 to 44 age band - Auckland Region
Age Band
|
1996-2001
|
2001-2006
|
2006-2011
|
2011-2016
|
25-44
|
24,130
|
34,740
|
-330
|
54,470
|
What is the housing demand for this segment? If we assume that every 2 people equals one house, then we get the following demand:
Table 5: Assumed dwelling demand - first home buyers
| Year |
1996-2001
|
2001-2006
|
2006-2011
|
2011-2016
|
Dwelling demand @ 2 people per dwelling
|
12,065
|
17,370
|
- 165
|
27,235
|
Notice between 2006 to 2011 there was a decrease in the number of people in the 25 to 45 age band, hence a drop in demand. I have used a figure of 2 people per dwelling as a guess. The actual number of occupants per dwelling is likely to be a bit higher than this, as there will also be some people below 24 years old in households, which means that the actual figure will be closer to the regional average of just under 3 people per dwelling.
Between 2001 to 2006, the census records that 48,000 dwellings were added to the regional stock.
If we take all three segments and their increase in number then we get the following figures on housing demand, close to the number of dwellings built. A coincidence possibly, but lets run with it:
Table 6: Housing Demand 2001 to 2006
Age Bands
|
Growth in population 2001 to 2006
|
Housing demand
|
25-44
|
34,740
|
17,370
|
45-64
|
43,110
|
21,555
|
65+
|
14,400
|
7,200
|
Total
|
|
46,125
|
We can now compare that demand from the new entrants with the size of the potential upgrade market. That is, how many households in the upgrade segment would need to shift into a new house to free up space for the new entrants?
Let’s assume that the ‘base’ for the upgrade market is the current number of households in the 45 to 65 age band. I don’t have figures on the number of dwellings occupied by people in this age band. I can only take a stab, again using a guess at 2 people per dwelling.
The following figures are generated:
Table 7: Number of possible upgraders
|
2001
|
2006
|
2011
|
2016
|
Number of people in 45 to 64 age bands
|
378,790
|
421,900
|
422,280
|
442,940
|
Dwelling upgrade ‘pool’
|
193,785
|
211,155
|
210,990
|
238,225
|
Not all of these dwellings are owned by the occupiers. Census data for tenure by age band suggests that 65% of houses occupied by 45 to 65 year olds are owned by the occupiers. Some of these households may not have the income needed to upgrade, although then may have increased equity that they could use. If we assume that 10% of the 65% of dwellings occupied by the 45 to 65 year age group don’t have enough income to upgrade, then the eligible pool is more like 58% of the dwellings in the 45 to 65 pool.
We can then compare that number with the demand for entry level dwellings, as set out in Table 7. While over the period 2001 to 2011, it seems reasonable to expect the upgrade process to be of sufficient size to meet the needs of new entrants, by 2016, with big influx of younger people into the region, the upgrade process is unlikely to free up enough houses to meet that demand.
Table 8: Upgraders versus first home buyers
|
2001
|
2006
|
2011
|
2016
|
Eligible dwellings in the upgrade pool
|
113,364
|
123,526
|
123,429
|
139,362
|
Percentage that would need to upgrade to make room for new entrants
|
11%
|
14%
|
0%
|
20%
|
So maybe in the period 2001 to 2011, the upgrade concept worked. Enough existing homeowners (say 10 to 15%) could have shifted to a new home to make way for new entrants. But by 2016, with the large surge in the number of people in the mid 20s age bands, the number of upgraders would need to rise significantly to make space for these new entrants. One in five seems a big number of upgraders.
I haven’t looked at the income side of things. Filtering seemed to have worked best during the 1950s through to the 70s, possibly in part due to rising incomes for middle income households allowing many existing households to upgrade. But since the 1990s, household incomes in the middle income bands have tended to flat line, more so in the new century. This must surely slow the upgrade market. There is a wealth effect as existing households benefit from increased house prices, but rather than use that wealth as a stepping stone to an upgrade, my impression is that many households have used that wealth to consume more housing - buying an investment property.
This is by no means a conclusive analysis. The intention is to develop a different take on the usual narrative of the reason for a ‘deficit’ of housing in the Auckland Region; different that is to the standard analysis of population growth versus dwelling permits issued. As with my previous post, it suggests alternative, rational explanations of a deficit are feasible, and it is not just a ‘land supply’ issue.
In terms of urban planning, the concepts of the upgrade market and filtering are useful and important. Upgrades help with the supply of all types of housing. The concepts should influence the location of additional housing capacity. However by themselves they seem unlikely to meet all housing needs in a growing city and other actions are needed.
And there is also a big sting in the tail. Taken to its logical conclusion, if filtering is encouraged as much as possible, with more new homes built that new entrants coming into the market, then the inevitable outcome is significant decline in some suburbs, as a 2001 Brooking Institute report(4)
notes:
America has yet to come to grips with the fact that its way of dealing with “old” real estate, which is the same way that it deals with cars and refrigerators, eventually decimates suburbs just as it decimated major cities. Use, sell, move on. The only difference is time – houses decline more slowly. The slow pace of decline is unfortunate because it dilutes the impact of what is happening. If all the decline that occurred in the past 25 years had instead been contained within one year, surely civil and political upheaval would have followed. Such decimation would not be tolerated. But as it is, decline is a slow death by a thousand cuts. There is no perceived crisis until it is too late.
(1) https://community.bnz.co.nz/t/migration-flows-and-aucklands-housing-shortage/488
(2) https://nzinitiative.org.nz/insights/media/media-release-nz-initiative-addresses-immigration-fears-in-new-report/
(3) https://www.westpac.co.nz/rednews/property/aucklands-first-home-buyers-say-no-to-apartments-prefer-the-burbs/
(4) https://www.brookings.edu/wp-content/uploads/2016/06/bier.pd