Wednesday 21 February 2018

Houses, flats and apartments (2) - the missing middle and the return of the sausage

One of the answers to Auckland's housing crises has been revealed as the Auckland Council starts to implement the new Auckland Unitary Plan.

Here is my pick of the housing 'game changer' that the plan will unleash:


Yes, the ubiquitous ‘sausage flats’ – units joined together and generally laid in a row (the sausage) at right angles to the road frontage - are set to return.

Why? Two things:

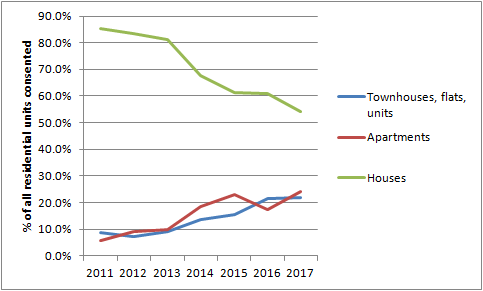
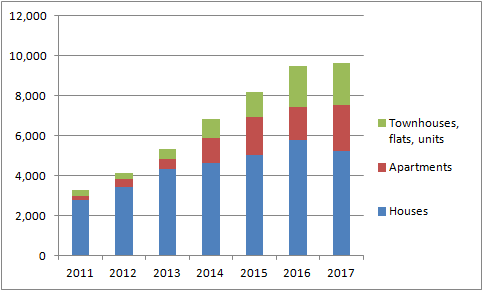
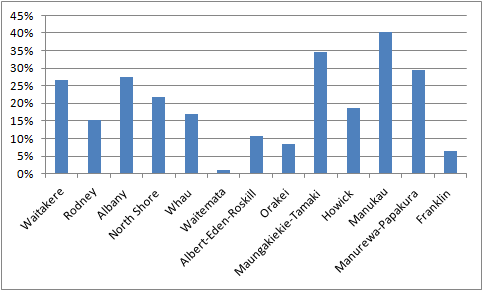
First, the figure below is from a monitoring report on the Auckland Plan. It shows the anticipated dwelling growth in the first decade (2012-2021) of the 30 year plan, by Auckland Plan development strategy category; compared with actually consented dwellings over the first five years (2012-2017).


The greenfield, future urban areas - the tall grey bar in the middle of the graph - have taken much less growth than anticipated (blue bar versus grey bar). Most of these areas are areas zoned for housing, so its not like they are all just paddocks awaiting rezoning . The central area has also seen much less growth. Suburban areas (Areas of least, some or more moderate change in the figure) have taken much more.


So it is not the fringe that is developing, nor the centre, it is the ‘middle’.

Secondly, much is made of the missing middle in the density gradient across the middle part of the city. See for example: http://missingmiddlehousing.com/. It is often claimed that there is a gap between the high rise, high density apartment tower blocks found in the central city and the low density, stand alone houses  of the suburbs. There is a gap between these two typologies where there should be medium density type units - like townhouses, flats and terraces and mid rise apartments. This 'gap' needs to be filled to help meet housing needs.

Many people say that the gap is the result of planning controls that require minimum site areas and similar land consuming rules, like minimum on-site car parking requirements. But equally many people seem to miss the point that the Auckland Unitary Plan has made big strides to open up the opportunity for the 'missing middle'. The Mixed Housing Urban and Suburban zones of the Unitary Plan are the most ubiquitous of the urban zones used by the plan, and neither zone has minimum density controls (although yard, height outlook and coverage controls still apply).

In this blog I want to start to look  at the urban design and planning  issues involved in the missing middle in the middle. More will follow.

To start with, I don't think the 'middle' is actually missing in Auckland; in fact it is very prevalent, perhaps too prevalent. According to the Council, close to one-third of all property titles in Auckland are multi-owned, either being cross lease (18 per cent) or unit titles (13 per cent).

Long a feature of the kiwi suburbia is the brick and tile sausage flats . They were often the first phase of urban redevelopment providing affordable, well built, ‘modular’ units in many of our older suburbs.


One estimate is that Auckland could have at least 100,000 such properties. Many were built by “Franchi and Ion”.  The NZ Herald once reported that “At one point twins Trev and Mil Ion and business partner Noel Franchi had 37 gangs of builders working on the North Shore alone, says nephew Ron Ion. It was a different era. Franchi told the younger Ion at a funeral a few years ago that they would buy a section on the weekend and telephone the council on the Monday to let staff know that the footings were in place. An in-house draftsman would have the exact plans ready by Wednesday”.

As far as I know, the sausage block building form was shaped in response to the prevailing lot shape and dimensions  (long and skinny) and simple bulk and location controls that used to apply.

If you take a section that is roughly 20m wide and 50m deep (1,000m2), draw a 2 or 3m wide yard around the edges, plus space for a driveway down one side, 35% site coverage  you get a sausage flat footprint.  No minimum density controls, outlook or outdoor living areas to struggle with.

They may have lacked some style......


outlook, open space and landscape treatment......


and then there is the problem of where to stick the wheelie bins and cars ....


but they kind of worked. My granny used to live in, and I flatted in one for a while.

At some point, the evolution of the sausage flat was haltered.

Minimum densities per unit came into play, outdoor living courts and the like, so rather than a sausage, you got a series of peas in a pod....


They did have a bit more green between them, and you did get your own house. This type of infill development is very common, and it was also an efficient form of urban intensification.

But as land values rise and the ability to afford a stand alone house disappears, my pick is that the sausage flat will return. In fact I predict that many of the sites picked for low to mid rise apartments in the Unitary Plan will end up as modern day sausage flats.  This is because of the apparent preference for an identifiable separate unit and the ability to fit four or five flats on a ‘normal’ section.

Compared to the 1960s, these days sausages come in all sorts of flavours. The hope is that just as the humble sausage has advanced in the past few years, so too will its counterpart,  the sausage flat.

But compared to the 1960s and 1970s versions, many of which were one storey, it is likely that most new sausage flats will be two or three storeys (garage below with two storeys of living area above). This format raises significant issues with outlook and overlooking when the units sit side on to the street, which is by far the most likely format. Street interfaces are also problematical where the units are side on, so too is the loss of back yards.

Here is one line of units side on to the street overlooking a bungalow, with another row of units behind that  (admittedly these units are pre AUP, they are built on an old Business zoned site which used to be a service station).


No hidden density here. Neither are there the standard urban design responses of ‘backs-to-backs’ and ‘perimeter block’ layouts. The Auckland Design Manual seems silent on the issues of how to do  medium density in a sausage block form well, when it is a site-by-site process of development.

Is this a problem? The above example is not necessarily bad. The question is more have we got to grips with the likely design issues, given that in planning terms we kind of have turned full circle.


Note 1: Auckland Plan Development Strategy Annual Monitoring Report 2016/17: http://www.knowledgeauckland.org.nz/publication/?mid=1784
Note 2: http://www.nzherald.co.nz/property/news/article.cfm?c_id=8&objectid=11630116

Friday 2 February 2018

Houses, flats and apartments


A review of building consents issued in the Auckland Region over the 6 years 2011 to 2017 provides some pointers as to the nature and extent of ‘affordable’ forms of intensification.

Overall (and setting aside retirement village units as a separate market-sector at this point), stand alone houses have dropped from 85% of all house, apartment and townhouse units consented in the Auckland region in 2011 to 54% in 2017 (based on November years).

Figure One: Share of residential building consents, Auckland Region, by type of dwelling


Apartment units form 24% of dwellings consented in 2017, while townhouses, flats and other units represent a 22% share of the dwellings consented.

The above figures are for the whole of the Auckland region. Narrowed down to the existing urban area, it is likely that apartments and flats will be a higher proportion. Sub regional data on building permits issued is only freely available at the Ward level. Just looking at the main urban Wards, in the 12 months between October 2016 and November 2017, 44% of dwelling units consented were stand alone houses, 26% were apartments., 22% flats and 8% retirement units.

Type Number Percentage 

Houses
3881 44%
Apartments 2338 26%
Retirement village units 678 8%
Townhouses, flats, units, and other dwellings 1974 22%
Total 8871 100%


How Stats NZ classify a residential dwelling as a ‘town house, flat or unit’, rather than an ‘house’ or an ‘apartment’  is not clear. Their website says that examples of townhouses, flats, units and other dwellings include granny flats, and minor dwellings such as studios. Stats NZ say houses are houses not attached to other houses, so terrace houses are presumably in the townhouses, flats and units count (horizontally attached units), while apartments likely mean vertically attached units.

Apartments have increased their market share the most over the 6 years, but the pattern of growth is pretty similar for townhouses, flats and units.

In terms of absolute numbers, the following stacker graph shows how annual consents for dwellings have gone from 3,000 in 2011 to around 9,500 in 2016 and 2017 (with retirement units on top of this, taking the total to over 10,000 in 2017).

Figure Two: Number of residential building consents issued, 2011 to 2017, Auckland Region.


The number of consents for stand alone houses dropped by around 550 between 2016 and 2017.

So more intensive forms of development are now over half of the new building stock in the urban part of the city (55% of new units) which sounds positive. However as previously noted, apartments are not necessarily cheaper than stand alone houses.

The following graph shows average build costs as recorded by building permits.

Figure Three: Average build cost by type of dwelling unit, 2011-17, Auckland Region


In terms of the cost of building, the average build cost of town houses, flats and units is about 50% of that of a house or apartment. It is interesting that the build cost of an apartment unit is now about the same as a house. The cost of building an apartment has shot up over the past 6 years. Others have noted that there has been a shift in the apartment market away from smaller, cheaper units aimed at investors to larger, more expensive units aimed at owner-occupiers.

So the average house now costs something like $460,000 to build. This is (I think) before site works, fees and charges and developer's margin. Add those in and costs may be closer to $600,000. Then you need to add land.

But you do not have to build a large house, It could be a more modest townhouse, flat or unit which may cost (all up) closer to $350,000 to build.

The average floor area of the three different types of dwelling units are quite different, while the cost to build per square metre also varies.

Looking first at floor area, the average floor area for houses has been steady at around 230m2 over the period 2011 to 2017.

Figure Four: Average floor area by residential dwelling type 2011 -2017, Auckland Region


Apartments and townhouses/flats/units are about half this size, between 100 and 120m2 respectively. I presume the average floor area for apartments is a gross area that covers the internal floor area of the apartment, as well as common areas like lobbies and corridors. The average floor area for a house presumably also often includes an attached (internal) garage, which could easily be 40 or 50m2.

In terms of construction costs per square metre, townhouses, flats and units have the same build cost as houses. Apartments have seen a big rise in costs per square metres.

Figure Five: Average build cost per square metre, 2011 to 2017, Auckland Region


The rise in the build cost be square metre for apartments may reflect the shift in target market, rather than just increasing costs of materials.

Comparing costs of construction with sale values helps to identify the extent to which land prices are an input into overall prices. A large proportion of sales value attributable to land, relative to the typology, may suggest that something is causing too much land to be ‘attached’ to the dwelling (such as minimum density controls), or may just reflect consumer preference.

Such a comparison is not easy, especially as there is no consistent classification system for the different types of dwelling units, while sales of houses, flats and apartments will cover plenty of older stock. So, for example,  sale values of apartments will reflect the historical emphasis on small, cheaper units.

QV has data for the Auckland region on median sale values for  houses, flats and apartments (new and existing combined) for the 3 months prior to November 2017, as follows.

Figure Six. Median sale price, 3 months to December 2017, Auckland Region


It is interesting to compare these sale prices with the costs of construction (as collected by the Building Permit data).

Figure Seven. Median sale price versus average build cost, 2017, Auckland Region


You would expect the costs of construction of an apartment to be close to the sale values, as the land component is very small. Likewise for a stand alone house, land will make up a much bigger proportion of the sale values, The above figures suggest a 50/50 split. The odd one out is the flats category. Here construction costs as recorded by Stats NZ are only about 1/3rd of the sale prices as recorded by QV, when logic would suggest something in between houses and apartments, more like construction costs being about 60% of sale values.

It may be that it is not possible to compare Stats NZ building permit data with the QV data on sales values. The two sets may not be an ‘apple for apple’ comparison, especially for the flats/townhouse component.

Nevertheless, the figures suggest that the sale value of town houses and flats may be ‘above the odds’ and my suspicion is that the sale value of flats has been dragged up by the value of stand alone houses, as well as past density controls attaching ‘too’ much land to this type of dwelling. Certainly on a per square metre of floor space basis, the sales value of a flat is well ahead of the other two types of dwellings.

Figure Eight: Median sale price based on per square metre of new floorspace


The sale values of apartments will reflect current stock, and in reality sale values of new apartments are closer to $10,000 per square metre. It is likely that over time as the market shifts from investors to owner occupiers, median sale values will increase.


The summary is that to help with affordability, we need more townhouses, flats and units, and the sale values of those units should better reflect their lower land component, that is implied at least, by this type of housing and their smaller floor area than stand alone houses. The above figures suggest a degree of ‘excess profit’ for flats and townhouses and hopefully this will spur developers and builders to focus on this market and over time see sale prices come closer to construction and land costs.

Where have these types of units been most commonly built?

The following bar graph and map shows the percentage of all residential consents that were for townhouses, flats and units, by Ward, for the 12 months to November 2017.

Figure Nine: Flats as percentage of residential building consents, by Ward for Auckland Region, 2017  


The following maps the percentage by Ward.


Figure Ten: Flats as percentage of residential building consents, by Ward for Auckland Region, 2017


The pattern is of a higher percentage to the north and south of the region, towards the edges of the urban area, with a weighting to the south. The west does not have a strong emphasis on this type of housing. The central Isthmus has very few townhouses, flats and units consented (apartments are likely to be more important).

In terms of absolute numbers, Albany Ward is the winner by a large margin. Why so many in this ward? There are a number of large greenfields development areas in this Ward (ie Hobsonville and Albany Basin) so maybe it represents the extent of opportunities available.

Figure 11. Number of building consents for flats and townhouses, Auckland Region, 2017


The data suggests that the inner Isthmus needs to concentrate on apartments. Beyond that inner core to the region, there needs to be a ring of zoning that facilities flats, units and townhouses. The AUP’s Mixed Housing Suburban and Urban zones attempt to provide this type of opportunity, but it may be that there needs to be more of the urban category and less of the suburban category, especially closer into the core, and in the eastern and northern coastal fringes of the city.