Things fall apart, the centre

The top line results from the 2023 census are out and the results pose some interesting questions on Auckland’s growth and development.
First up, as a share of the total population of New Zealand, the Auckland Region slipped slightly between 2013 and 2023. In 2013, Auckland was home to 33.4% of the country’s population. By 2023 this has slipped to 33.2%.
Table 1: Population Share Auckland 2013 to 2023
Not a big drop, but is it the start of a trend towards slower growth relative to other areas? Certainly high house, rent and transport costs in Auckland will make other areas more desirable. Others have pointed out that fast growth of Waikato may in part be a displacement of growth out of Auckland, for example.
Auckland is supposed to demonstrate a productivity gain from its larger size and deeper labour market, meaning that there is in theory a reduction in overall productivity if a household shifts out of Auckland. Is Auckland’s productivity premium (which should be seen in higher incomes) no longer large enough to off-set higher housing and transport costs?
But per capita GDP data suggests that Auckland has experienced reasonable productivity gains over the past few years, at least relative to other areas. Figure 1 is GDP per capita for Auckland, Northland, Waikato and Bay of Plenty. Auckland is ahead of the pack.
Figure 1 GDP per capita 2000 to 2022

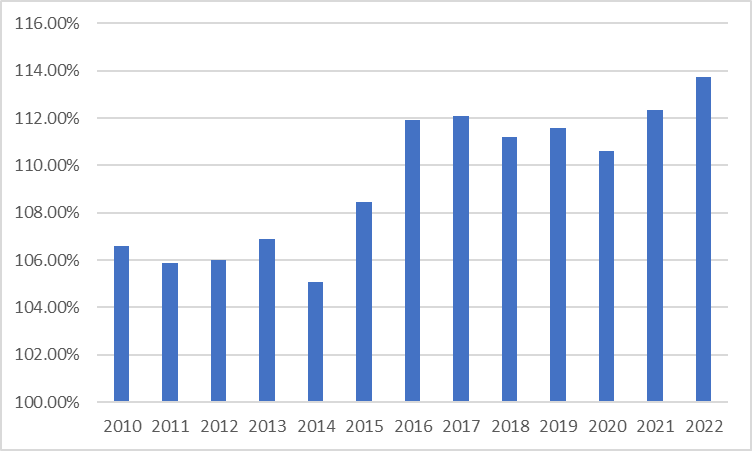
After a period of limited growth between about 2010 to 2015 (when Auckland’s per capita GDP premium was about 106% of national GDP), post 2015, Auckland saw per capita GDP grow so it sits at around 112% of the national figure.
Figure 2: Auckland GDP per capita as a % of NZ per capita
Turning to housing, in terms of housing production, between 2013 and 2023, Auckland added 436 dwellings per 1,000 new residents, above the national figure of 399 dwellings per 1,000 residents.
Table 2: Dwellings per1,000 new residents
So is the much debated role of zoning and planning in constraining Auckland’s growth a reality?
Perhaps not at the regional level, but may be at the local level. Looking at population growth by Local Board area shows a strong pattern of growth on the edges of the city, and (small declines) in the central areas. See figure 3.
Figure 3: Population change by Local Board area 2018-2023
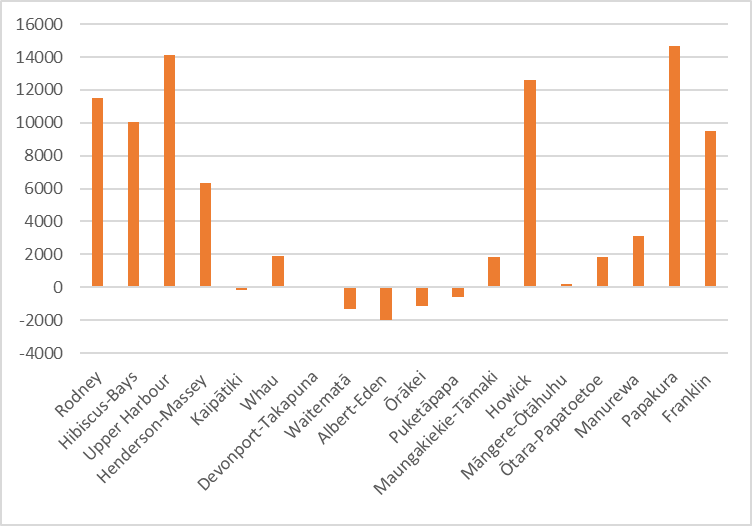
This is hardly the picture of a consolidating, more compact urban area.
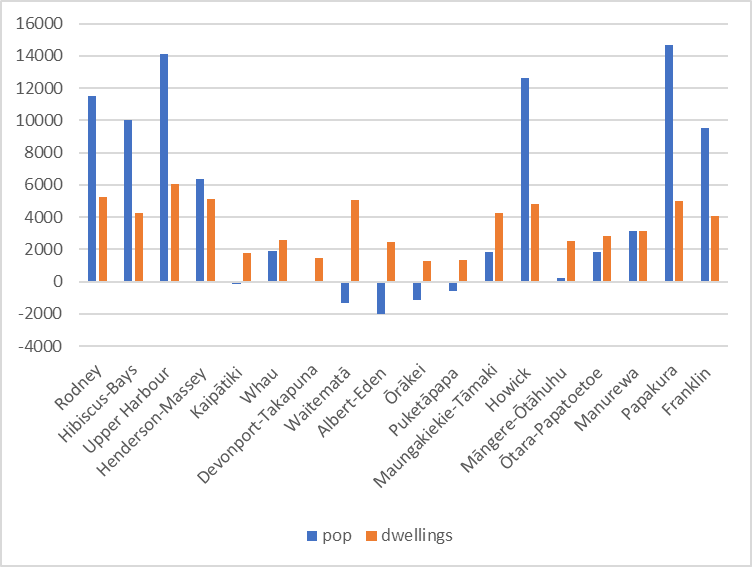
But house growth has not been static in the central suburbs. For example, the Waitemata Local Board area added about 5,000 dwellings, but lost 1,300 residents. Possibly that loss is due to fewer international students. It is also possible that the central city suburbs are going through a demographic transition towards empty nesters, with average dwelling occupancy declining as the population ages. At some point that will turn around.
Figure 4: Population and housing growth 2018-2023, by Local Board
But nevertheless the data on population, housing and GDP present something of a paradox. It is often stated that greater density of urban development - with that density concentrated into central areas - will support increased productivity.
Even more perplexing is comparing job growth with population growth. Figure 5 is growth of employment by Local Board area between 2018 and 2023. What stands out is the stellar performance of the Waitemata Local Board area - employment rich but population growth wise a desert.
Figure 4: Emplpoyment and resident population growth 2018-2023 by Local Board

Auckland displays increased productivity but reduced pace of growth and a de-concentration of, at least, population. Is the city starting to experience a structural shift in its organisation? A shift to the edge in search of more space and cheaper housing may have been facilitated by working from home. Will the “donut effect" accelerate? And how to respond with more public transport and greater housing diversity and density in suburban areas.
Or is the 2018-2023 pattern of limited population growth in the centre a covid induced temporary ‘blip’?