Further to my previous post about changes in transport conditions, land values and distance from the centre, here are a few more facts and figures.
The following graph shows changes in the value of houses between 2007 and 2016, by travel distance from the CBD. The values are based on QV’s house index, as reported by the NZ Herald. Travel distance are as measured by Google maps.
The following graph shows changes in the value of houses between 2007 and 2016, by travel distance from the CBD. The values are based on QV’s house index, as reported by the NZ Herald. Travel distance are as measured by Google maps.
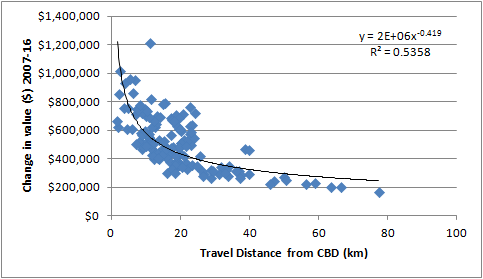
The central areas have seen the largest increases in house values, consistent with the principle of a re balancing of transport accessibility and land values back towards central areas.
The graph also supports the notion of the '30km city', with most suburbs within 40km travel distance of the CBD. The 30km city is as the crow flies, so on the ground travel distances may be up to 40km.
As for travel times, the NZ Household Travel Survey (http://nzdotstat.stats.govt.nz/wbos/Index.aspx?DataSetCode=TABLECODE7432#) lists for the Auckland Urban Area for the period 2011 to 2014, average journey to work travel time of 24.7 minutes.
In terms of actual dollar transport costs faced by households, the following data is from Stats NZ household expenditure survey, for the Auckland Region. Transport costs have hovered around the 14% mark (14% of total household expenditure). While over a relatively short period of time, the constant percentage of household expenditure implies a household travel budget. As transport costs fall, that budget is probably used to travel further distances, as costs rise then distances travelled probably reduce.
Year
|
Transport costs as % of total household expenditure
|
2007
|
14.2%
|
2010
|
12.9%
|
2013
|
14.2%
|