In my post of the 20 August 2017, I looked at urban development trigger points based on land values. This was to inform zoning based on land value. I came up with the following typologies, based on some rough estimates of what type of unit is cheaper to build. The basic idea is that as land values rise, then land area per dwelling unit needs to drops to maintain affordability. Floor area may also get a bit smaller. At some point, higher land values mean that the higher construction costs of apartments sees a dwelling unit that is cheaper to produce than a stand alone or terrace house, even when those types of houses have a much cheaper per square metre build cost. My rough guess was as follows:
Land value up to $1,500 per square metre
Two storey stand alone houses, town houses and infill type units
Land value between $1,500 and $2,000 per square metre:
Two or three storey terrace or row houses
Land value over $2,000 per square metre:
Four storey plus apartments.

In those calculations I did not include developer’s profit. Quite why, I’m not too sure. This is after I had questioned the absence of developer's profit in other calculations of the cost of land use regulations (see 6 August 2017).
So I have had a recalculation.
Developer’s profit is often based on build costs. My understanding is that 20% of costs is a pretty standard rule of thumb as to what banks will expect as a developers' margin. This is the figure used by the Auckland IHP in its feasibility testing. The recent Auckland Mayoral Taskforce on Housing suggested that developer's margin was in the order of 18 to 22% of total costs (land and building). Whether the developer ever sees this profit is a different issue - this is just a feasibility test.
Including developer’s profit doesn’t really change the basic approach that I set out above. As the profit is a ratio of build costs, the basic relationships between land values and build costs do not change. Below is my recalculation of the $2,000 per square metre land value scenario, with developer’s profit included.
The calculation results in an apartment of about $850,000. Interestingly, Colliers recently said that the average selling price for an apartment in places like Albany and Stonefields was $824,000 and up to $ 1.32 million in the CBD.
The calculation results in an apartment of about $850,000. Interestingly, Colliers recently said that the average selling price for an apartment in places like Albany and Stonefields was $824,000 and up to $ 1.32 million in the CBD.
In my calculations, apartments are about 15% cheaper than stand alone houses, and therefore likely to be a marketable product, when land values are $2000 per square metre. Note, I have also fiddled with the average apartment size (gross floor area) to make it 130 square metres rather than 150 square metres. The 130 square metres is my guess as to an actual living area of about 90 square metres, with the rest made up by a car park and common access areas (like lobbies, corridors and stair wells).
Stand alone house
|
Apartment
| |
Land area (sqm)
|
1,000
|
1,000
|
Land value $ per sqm
|
$ 2,000
|
$ 2,000
|
Total land value
|
$ 2,000,000
|
$ 2,000,000
|
Building coverage
|
35%
|
35%
|
Storeys
|
2
|
5
|
Floor area (sqm)
|
700
|
1750
|
Costs to build per sqm
|
$ 2,200
|
$ 4,500
|
Cost of build
|
$ 1,540,000
|
$ 7,875,000
|
Developer’s profit
|
$ 308,000
|
$ 1,575,000
|
Total cost
|
$ 3,848,000
|
$ 11,450,000
|
Average floor area (sqm) per unit
|
200
|
130
|
Units
|
4
|
13
|
Cost
|
$ 1,099,429
|
$ 850,571
|
To put the above land values in context, here is a map from Council’s GIS system of land values per square metre for the inner Western Bays, based on 2014 valuations. The red areas are the areas with land values over $2,000 per square metre. These land values will be updated soon with a revaluation occurring this year. Growth in prices between 2014 and 2017 will be reflected in these revaluations. The red areas are likely to have got a bit bigger.
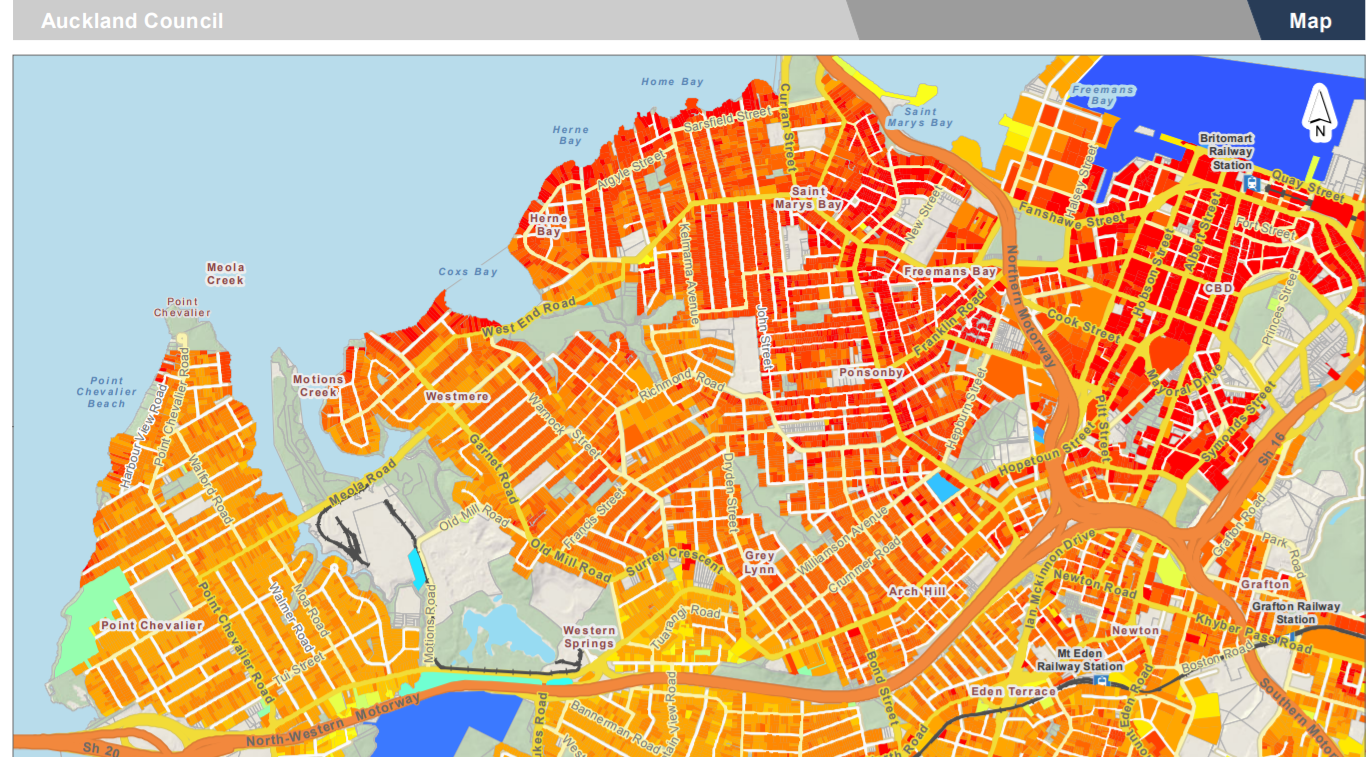
Much of the red is in the Ponsonby / Freemans Bay / Herne Bay area. The coastal edge is mostly red. The darker orange areas like Pt Chevalier are between $1,500 and $2,000 per square metres. It is a pretty quick transition in land values out from the CBD.
If the above map is compared with the one below, which shows recent building consents for apartments and terraces (via the RCG Development Tracker website), then there is a pretty clear co-relation with the red areas.

Great North Road has seen some apartment development. Land values appear to be on the cusp of the $2,000 benchmark, and so tends to confirm the analysis. Great North Road also has the benefit of the former industrial sites. It is interesting how the apartments have developed on the western side of the road, but not the eastern side.
The analysis also suggests that most of Ponsonby and Herne Bay would probably transition over into apartments, if the zoning allowed.
The important point is that apartments are not really that cheap (they are relatively more affordable compared to a stand alone house). They are also really a high land value, inner city or coastal thing. Now of course the costs of the apartment could come down by a cheaper build and smaller floor area per unit, but that tends to lower quality, and narrower the number of buyers.
What is more likely to dominate the orange areas will be townhouses and terrace units - 2 or 3 storey units that share common walls. More on this soon.