Comparing one country's housing market with another (or one city against another) is fun.
For example we are often told that Germany has had low house price growth, with housing still affordable and that renting is common. They have built lots of houses, apparently, and the planning system is set up to enable growth. “The reason why Germany got more built is because there was greater political will to do so. And there are better incentives for towns and cities to deliver the housing that their citizens need”. This is the view of the NZ Initiative (see note 1).
What is not mentioned is that Germany’s population is pretty stable and the outlook is for a declining population. The country’s population was 80.9m in 2010 and 82.2m in 2018. By 2030 it is expected to be 82.1m. So not a lot of growth overall, and ask any low growing NZ city and they will say that they have room to build more houses, if people came.
Having said that, some German cities are growing and some reports suggest that this is putting pressure on housing, just like Auckland. This from a 2018 review of the German Housing Market by Deutsche Bank (see note 2):
Metropolitan areas in Germany are booming. The current real-estate cycle started in 2009 and has led to significant price increases for residential property in many cities. Prices for apartments have as much as doubled in some cities. Strong population and employment growth and declining unemployment rates are driving demand, and supply elasticity is low. New construction is slow to pick up, and vacancy rates are declining. As a result, rent growth is accelerating. Regulatory measures are unlikely to provide sufficient relief. House prices and rents look set to rise markedly in 2018.
The review even mentions the possibility of a housing bubble!
So if German cities have an incentive to plan for growth, why are house prices growing in some areas? Maybe prices are not growing as fast as Auckland - who knows. Context is everything.
A different quoted example of a city that has kept housing affordable is Montreal. Does Montreal hold any clues as to how Auckland might grow in a way that recognises the ‘density challenge’ Auckland faces while enabling housing supply that can address affordability?
Montreal is one case study mentioned in a report called “Yes you can build your way to affordable housing. Lessons from unexpected places” (note 3). This report argues that there are number of big cities where housing supply has kept pace with demand. The title of the report tends to imply that cities can build themselves out of an affordability ‘hole’. While none of the cities listed have gone from unaffordability to affordability due to lots of extra housing supply, at least none of the cities have gone from affordability to unaffordability. Listed are Houston, Chicago, Tokyo, Vienna and Montreal.
Why focus on Montreal? Well it has the same population density as Auckland - around 2700 people per square kilometre - but house prices are a lot less, compared to incomes. On a basic median household income multiplier, Montreal median house prices are 4.78 median incomes, while Auckland is over 10.
Montreal is also a liveable, pleasant city (except perhaps in mid winter). Montreal is 23rd on the Mercer quality of living index, while Auckland is 3rd. Montreal is well ahead of Chicago at 47, Tokyo at 48 and Houston at 67.
But most of all, it is a city that seems to focus on the 'middle'.
To put Auckland and Montreal in context, the table at the end of this post (Table 1) lists a range of data from two Demographia reports - on world urban areas and housing affordability. While Demographia’s analysis of housing affordability is pretty blunt (median incomes to median house prices) at least it allows for comparisons across cities. The data on urban area population and urban land area is based on Demographia data, the exact details of which are not set out in their report, but the population figures seem close enough. For example, Stats NZ report that at 2013, the Auckland urban area (as defined by them) had a population of 1.38m. Demographia list Auckland’s urban population as 1.41m as of 2014. The critical number is the physical size of the urban area. That is more difficult to measure.
I have listed cities over 1m people in NZ (Auckland obviously), Australia and Canada - our Commonwealth cuzzies. I'm not too sure about comparisons with European and American cities given the different historical and socio-economic factors. Table 2 lists the data on size, density and affordability for Vienna, Houston and Chicago.
If cities in the sample of Commonwealth countries are ogranised by population density (people per square kilometre), then Auckland is the second most densely developed city of the sample, second to Toronoto, with Montreal close by.

If density is organised by urban area population (from larger to smaller), then Auckland is much more densely developed than its peers.
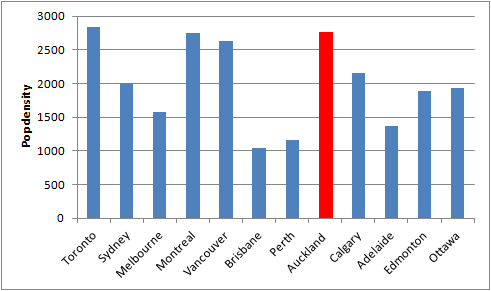
Other cities with more affordable housing listed in the table - places like Ottawa and Edmonton in Canada and Perth and Brisbane in Australia - are much lower density than Auckland. Places with similar or higher densities to Auckland - such as Vancouver and Toronto - are equally expensive, except for Montreal.
The following scatter plot is of median income multiplier (median house price divided by median household income) and urban density. There is no obvious pattern or relationship between density and affordability.
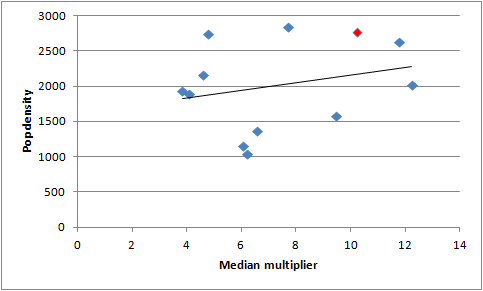
There are four cities with similar density to Auckland (red dot at top right). Montreal is the top, left hand dot.
Montreal is a lot bigger than Auckland at 3.55 million people, but it is growing slower than Auckland, 1% per anum rather than 2%. The difference between 1 and 2% may sound small, but I think the rate of growth is an important issue. A moderate growth rate is a lot easier to manage than a faster growth rate.
Auckland looks like it has higher household incomes, but also a much higher median house price.
What other factors may influence house prices?
When you look at the Montreal metro area, then most of the urban footprint is within 20km of the city centre. The city is basically the shape of a circle.

The blog site ‘Urbankchoze.blogspot” notes that Montréal's downtown area is located on an island, which itself is on a river, but the island is well-equipped in terms of bridges and roads, with some commuter rail too. As a result, (the city) is able to "sprawl" in every direction, and once passed the river, there are flatlands, perfect for development.
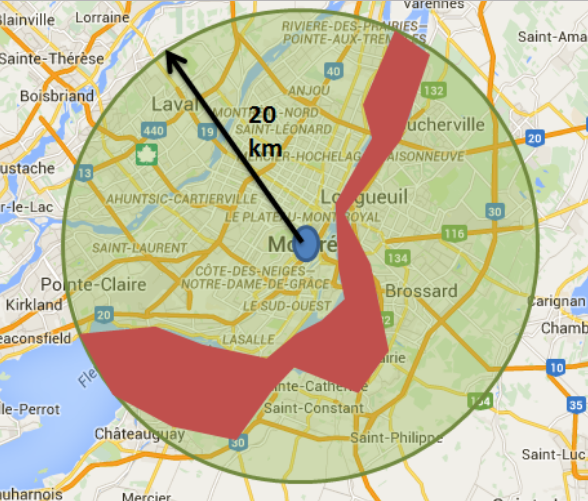
Being able to grow in all directions makes a big difference to transport outcomes and the amount of land needed to accommodate growth. And by the looks of things, there is plenty of land to expand into.
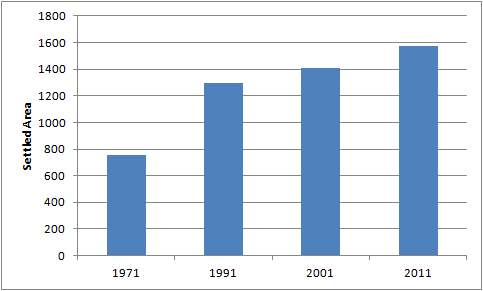
Figures provided by Stats Canada show that Montreal hasn’t been shy about expanding its urban footprint. The settled area has basically doubled in size over the 40 years from 1971 to 2011.
Expansion of the housing stock has kept up with population growth. Between 2011 and 2016, Montreal added fewer people than Auckland, but more houses.
Population change 2011-16
|
Change in dwellings 2011-2016
|
New dwellings per 1000
| |
Auckland Region
|
154,900
|
37,758
|
244
|
Montreal urban area
|
131,942
|
44,769
|
339
|
Montreal has achieved this growth in a way that has not seen urban density substantially decline. If anything, it looks like density has gone up a bit over the past 10 years.
The aspect of Montreal that makes it worth looking at is its mix of housing. The city has a lot of 3 storey walk up type apartments. This is the standard format in the city's inner suburbs and they kind of set the character of the city.

Stand alone houses make up about 33% of the stock of occupied houses. The following graph shows the number of occupied dwellings in the metro area by topology.
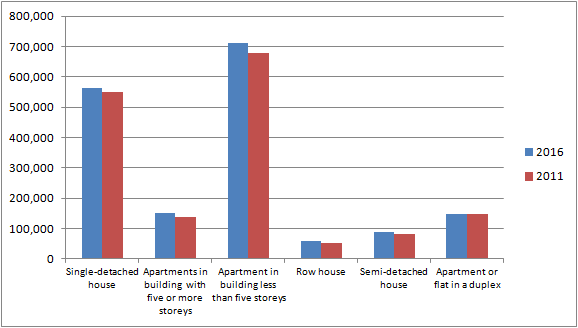
Auckland's profile is almost the opposite, although this is changing slowly. See my blog of 2 Feb 2018.
Some of the reasons given for Montreal’s ability to keep up with growth demands include:
- Plenty of land
- Moderate, not fast growth
- A history of medium intensity of development
- Zoning that enables moderately dense neighbourhoods.
Montréal has the advantage that zoning in most of the city, if it's not keen on high-rises, will at least typically allow low-rise apartments, and urban planners in the suburbs are open to the idea of allowing plenty of low-rise condos (and pressured to).
But the acceptance of medium density does not seem to be any planning-led strategy of sustainable development. It may lie in the history of the city. As observed by one Canadian newspaper in 2016:
As anyone who has visited the city can attest, it's full of three-storey walk-ups festooned with spiral staircases. The numbers bear this out. The greater Montreal area boasts about 500,000 rental apartments, compared with just 100,000 in the Vancouver area, which has about half Montreal's population.
That glut of supply can be traced back to the city's 19th-century roots. When Montreal was being built up, decades before most of Canada's urban areas, apartments were the standard housing unit of city life.
Three storey walk ups are not confined to the core. Apparently they are common in the suburbs. That may just reflect that the typology is the accepted norm for the city, as compared to Auckland’s preponderance of stand alone houses. Similar to Auckland, it looks like nobody in Montreal is too keen on taller apartments replacing 3 storey walk ups in the inner suburbs.
Somehow the city seems to have escaped the speculative pressures felt in the Vancouver and Toronto housing markets. Montreal used to be Canada’s largest city, but in the 1990s is suffered as Toronto grew. Pressure for Quebec to separate from the rest of Canada did not help. As reported by the Globe and Mail:
This….., is the story of Montreal's improbably cheap rent: ample but antique housing stock; a sluggish economy; and a language barrier that puts a soft cap on population growth. The bad news for the rest of Canada: It's a brew that may be easier to envy than to replicate.
Montreal is different to Auckland - different geography, different history and different growth pressures. The one interesting aspect is the emphasis on the middle density typology. That maybe worth looking at in more detail.
Table 1
City
|
Pop
(Millions)
|
Year
|
Pop
(millions)
|
Year
|
Area (km2)
|
Density people per square km
|
Median house price
|
Median Income
|
Ratio House price to income
|
Pop growth rate -
Annual
%
|
Vancouver
|
2.30
|
2017
|
2.26
|
2016
|
876
|
2626
|
$ 830,100
|
70,500
|
11.77
|
1.55%
|
Toronto
|
6.53
|
2017
|
6.43
|
2016
|
2300
|
2839
|
$ 615,800
|
79,700
|
7.73
|
1.51%
|
Ottawa
|
1.00
|
2017
|
0.99
|
2016
|
521
|
1929
|
$ 315,300
|
81,800
|
3.85
|
1.52%
|
Montreal
|
3.55
|
2017
|
3.52
|
2016
|
1294
|
2747
|
$ 284,700
|
59,500
|
4.78
|
0.99%
|
Edmonton
|
1.08
|
2017
|
1.06
|
2016
|
573
|
1894
|
$ 356,000
|
87,000
|
4.09
|
2.07%
|
Calgary
|
1.26
|
2017
|
1.23
|
2016
|
586
|
2159
|
$427,700
|
93,100
|
4.59
|
2.18%
|
Sydney
|
4.10
|
2017
|
3.90
|
2011
|
2037
|
2013
|
1,077,000
|
88,000
|
12.24
|
0.80%
|
Perth
|
1.81
|
2017
|
1.62
|
2011
|
1566
|
1159
|
$528,300
|
87,300
|
6.05
|
1.83%
|
Melbourne
|
4.01
|
2017
|
3.70
|
2011
|
2543
|
1577
|
$740,000
|
78,200
|
9.46
|
1.31%
|
Adelaide
|
1.16
|
2017
|
1.10
|
2011
|
852
|
1362
|
$435,000
|
66,000
|
6.59
|
0.83%
|
Brisbane
|
2.06
|
2017
|
1.87
|
2011
|
1972
|
1047
|
$ 495,000
|
79,400
|
6.23
|
1.63%
|
Auckland
|
1.50
|
2017
|
1.41
|
2014
|
544
|
2757
|
$ 850,000
|
83,000
|
10.24
|
2.01%
|
Table 2
City
|
Pop
(Millions)
|
Year
|
Pop
(millions)
|
Year
|
Area (km2)
|
Density people per square km
|
Median house price
|
Median Income
|
Ratio House price to income
|
Pop growth rate -
Annua
%
|
Vienna
|
1.78
|
2017
|
1.71
|
2010
|
453
|
3900
|
0.57%
| |||
Houston
|
6.15
|
2017
|
5.29
|
2010
|
4841
|
1100
|
$ 217,400
|
$ 62,800
|
3.46
|
2.18%
|
Chicago
|
9.14
|
2017
|
9.02
|
2010
|
6856
|
1300
|
$ 244,100
|
$ 64,500
|
3.78
|
0.19%
|
Note 1: https://www.stuff.co.nz/business/property/88739960/Germany-may-hold-the-key-to-solving-New-Zealands-housing-woes
Note 2: https://www.dbresearch.com/PROD/RPS_EN-PROD/PROD0000000000460528/The_German_housing_market_in_2018.pdf
Note 3: http://www.sightline.org/2017/09/21/yes-you-can-build-your-way-to-affordable-housing/
Note 4: http://urbankchoze.blogspot.co.nz/2015/04/why-is-montreal-so-much-more-affordable.html
Note 5: https://www.theglobeandmail.com/news/national/how-does-montreal-maintain-its-enviably-low-rents/article31285810/