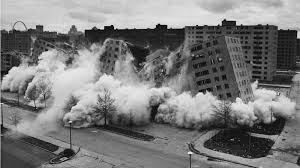
Tuesday, 14 August 2018

More on commercially feasible development and the UDC NPS

Was all that Unitary Plan rezoning angst necessary? That is the question that comes to mind from mulling over Auckland Council's latest attempts at working out what type of residential development is commercially feasible.

Elsewhere I have voiced some doubts about how commercially feasible development is calculated and if I have read the Council's latest report right, I think it tends to reinforce the argument that there is a big element of 'chasing your tail' in the way commercially feasible development is calculated.

The Auckland Unitary Plan went to great lengths to find sufficient commercially feasible development to meet estimated future needs. Luckily for the plan, the  focus on commercially feasible development came part way through the  plan development process. The zoning pattern advanced through the draft plan was 'pumped up' to provide the requisite 'feasible' capacity.  There is nothing wrong with this, and the Independent Hearings Panel did a sterling job of uncovering capacity.  What is interesting is whether starting the plan development  process with the most recent  assessment of what is commercially feasible development might have ended up with a somewhat different zoning pattern - something that may not have worked so well in the long term.

These questions all came from reading the Auckland Council report: ‘Land covenants in Auckland and their effect on urban development’ (see Note 1). The report sparked a few thoughts about urban capacity, how it is measured and some of the implications if too much importance is placed on the modelling that goes into working out commercially feasible development.

To start the story, the National Policy Statement on Urban Development Capacity required the Council to report on capacity by 2017, and the Council did so in December 2017. The NPS has a big focus on ‘commercially feasible capacity’. There has to be enough commercially feasible capacity for 30 years growth.

The 2017 assessment said there was enough capacity in the short to medium term, but was a bit hazy on the detail about the outputs of Council's modelling of commercially feasible development, particularly the areas of the city where urban redevelopment is most feasible.

The December 2017 report was an update on modelling of capacity for the Auckland Unitary Plan Independent Hearings Panel process. There are some differences between the two sets of estimates, with a drop in commercially feasible development between the two assessments, not because of zoning changes but due to changing inputs around cost and other parameters, I think.

The ‘covenants’ report looked as the possible implications of restrictive private covenants on dwelling capacity (a topic that I am interested in,  but that is for another day). What is interesting is that the covenants report uses data from the 2017 modelling exercise that sheds a bit more light on feasibility by AUP zone.

What sparked my thinking was that if the sole focus of capacity is to provide enough commercially feasible development (as required by the NPS), then the data in the covenants report suggests a different zoning pattern to that set out in the AUP (OP). The information in the report potentially shows up the folly of trying to ‘chase’ the market, especially over a long planning horizon.

The covenants report sets out the following land area (hectares) in each of the main residential zones used in the AUP and the number of land titles in each zone. I think the number of titles is close enough to the number of dwellings in the zone. You get the following figures.


Zone
Total area (ha)
Total titles
Titles per ha
Large lot
       2,912
       6,879
2.4
Single House
       8,539
     86,191
10.1
Mixed Housing Suburban
     14,970
  199,468
13.3
Mixed Housing Urban
       7,531
  100,687
13.4
Terrace Housing and
Apartment Buildings
       2,485
     42,415
17.1
Total
     36,437
  435,640
12.0

The land areas in the different zones is very similar to the IHP's final capacity modelling report.

The pattern of ‘titles per hectare of zoned land’ seems logical, as you step up through the zones the density of development increases. The average of 12 titles per hectare across the five zones feels about right.

So you would think on the above numbers that adding more Terrace Housing and Apartment Building (THAB) zoning would be the way to add more dwelling capacity, if you needed to fit more dwellings into the existing urban area.  You would also think that it was helpful that the AUP zoned so much land THAB despite the worries and protests over ‘intensive development’.

If we then look at plan enabled capacity provided by these zones (that is, the physical capacity available) , as set out in the covenants report, then the benefits of the THAB zone are apparent. The next table shows plan enabled capacity by zone.  Plan enabled is additional dwellings.


Zone
Plan enabled
capacity
(dwellings)
Existing
titles
Total
dwellings
Dwellings
per ha
Large lot
       5,808
        6,879
       12,687
       4.4
Single House
      11,432
      86,191
        97,623
     11.4
Mixed Housing Suburban
   333,302
 199,468
   532,770
     35.6
Mixed Housing Urban
   258,992
   100,687
     359,679
     47.8
Terrace Housing and
Apartment Buildings
   296,730
      42,415
     339,145
  136.5
Total
  906,264
  435,640
 1,341,904
36.8

The additional number of dwellings possible (plan enabled)  is about the same as previous analysis, so all good.

The AUP residential zonings provide physical space for 900,000 more dwellings. The THAB zone makes a decent contribution to this total - 33%. There is room for 296,730 extra dwellings in this zone.

If those almost 300,000 dwellings in the THAB zone were not possible, then something else would have had to ‘give’. Based on the density of dwellings possible in the different zones, then to house this number of dwellings, you would need the following amount of land.


Zone option
Enabled Capacity
dwellings per ha
of land
Area (ha) need to
accommodate
296,730 dwellings
Large lot
2.0
   148,774 ha
Single House
1.3
   221,639 ha
Mixed Housing Suburban
22.3
      13,327 ha
Mixed Housing Urban
34.4
        8,628 ha
Terrace Housing and
Apartment Buildings
119.4
        2,485 ha

These are absurdly big numbers. If we just took the Mixed Housing Urban (MHU) as the next most likely zone, should land not be zoned THAB, then the Plan would have had to find another 6,143 hectares to zone as MHU (8,628 ha less the 2,485 ha zoned THAB). The 6,143 ha needed could be greenfields, much less Single House Zone (bye bye heritage suburbs) or more suburban areas subject to three storey development.

Thank goodness for the THAB, you might think.

But…...

If we then look at commercial feasible development, then a different picture emerges. Less THAB could mean more capacity. How is that possible?

The table below sets out the number of dwellings enabled by the plan and the number of dwellings that are considered to be commercially feasible, based on the 2017 report (and as reported in the covenants report).


Zone
Plan enabled dwelling
capacity
Commercially feasible
capacity
% feasible
Large lot
       5,808
   1,672
29%
Single House
     11,432
   3,250
28%
Mixed Housing Suburban
  333,302
 55,770
17%
Mixed Housing Urban
  258,992
41,313
16%
Terrace Housing and
Apartment Buildings
  296,730
   9,505
3%
Total
  906,264
111,510
12%

Across the urban residential zones, 12% of the plan enabled capacity is ‘feasible’. The percentage of enabled feasible capacity varies across the zones, from 27 to 28% in the low density zones, 15 to 16% in the medium density, but only 3% in the THAB. Only 3% ?

So of the big whack of capacity that is provided by the THAB zone, only a small proportion is currently 'feasible’.

If we look at the number of feasible dwellings per hectare of land zoned, then the most ‘productive’ zone is the MHU zone. For every hectare of land zoned MHU, 5.4 dwellings are feasible. But for every hectare of land zoned THAB, there is only 3.8 feasible dwellings.


Zone  
Commercial feasible
dwelling capacity
Feasible dwellings
per ha
Large lot
    1,672
0.574
Single House
    3,250
0.381
Mixed Housing Suburban
  55,770
3.725
Mixed Housing Urban
  41,313
5.486
Terrace Housing and
Apartment Buildings
    9,505
3.825
Total
111,510.0
3.060


If the land that was zoned THAB (all 2,485 hectares) was zoned MHU instead, then total commercially feasible capacity would go up, not down!


Zoning 
Terrace Housing and
Apartment Buildings
Mixed Housing
Urban
Mixed Housing
Suburban
Feasible dwellings
per ha
3.825
5.486
3.725
Total feasible dwellings
on 2,485 ha
9,505
 13,632
9,258

In fact you could just stick with Mixed Housing Suburban.

Is this sensible long term planning?  Don't we need to reserve some space for (well designed) 4 to 6 storey apartments around train stations, town centres (and in my book), around larger open spaces?

Go back a step to the IHP modelling, and the opposite was true. The modelling suggested on a feasible dwellings per ha basis, THAB was the best way to go. Below is a table that appeared in my blog of 10 December 2016.


Zone
Plan enabled capacity
Estimated feasible
capacity
Proportion capacity
"feasible"
Single House
34,445
11,259
33%
Mixed Housing Suburban
312,627
50,966
16%
Mixed Housing Urban
297,834
53,750
18%
Terrace Housing and
Apartment Building
325,648
45,929
14%


There are some differences in estimated plan enabled and commercially feasible development between the figures in the above table and the same figures in the covenants report, but not too much difference, apart from the THAB zone, where the number of commercially feasible developments has plummeted. From 14% in the IHP report  to 3% in 2017.

If we look at feasible dwellings per hectare of land zoned, then in the IHP report the numbers were as follows


Zone
Area (ha)
Feasible dwellings
per ha
Single House
8,761
1.29
Mixed Housing Suburban
12,497
4.08
Mixed Housing Urban
8,211
6.55
Terrace Housing and
Apartment Building
2,384
19.27

On the above figures, more THAB means less MHU and more Single House Zone, for example, if capacity is the name of the game.

Models are allowed to change. That is not the problem.

The point is, what do you plan for? If you were doing the AUP now, would you have MHU everywhere and not much THAB?

The above analysis may have some flaws to it. It may be that not much is commercially feasible on the land that is zoned THAB no matter what the zoning is, so just changing the zoning may make no difference. Maybe nobody wants to live an apartment - is that what the analysis of feasibility is now telling us? It is possible that if some different land was zoned THAB (like around the coast and inner suburbs) then commercially feasible numbers could be off the wall.

But why the difference between the IHP assessment and the latest assessment as to what is commercially feasible in the THAB zone? My own guess is that land values have adjusted to the new zoning, and are now hovering around the 'not feasible' mark, where they should be. Perhaps the moral of the story is the modelling approach used is OK before rezoning, but not much use after rezoning?

And what about the LRT that the region and the government wants to build? Does the feasibility testing take that into account?


Note 1: Land Covenants in Auckland and Their Effect on Urban Development. Craig Fredrickson July 2018. Auckland Council Technical Report 2018/013

Tuesday, 31 July 2018

National Planning Standards: some thoughts


The draft national planning standards that are out for comment are a curious thing.

The purpose of having national standards is not really clear to me. The MFE website says the following:

Currently, plans and policy statements prepared under the RMA are inconsistent with each other and slow and costly to prepare. They can be hard to understand, compare and comply with. This is because councils have generally developed their plans and policy statements independently of each other and without a common structure and format as a reference point.

The other side of the coin, that diverse landscapes, environments and communities should mean tailor made plans does not get mentioned. Neither does the innovation that arises from much experimentation of different formats and approaches. Surely we need to speed up the innovation process (try, succeed / fail, learn, try again ) rather than slow things down?

What do the draft standards tell us about urban planning in the the mid 2020s (given that is how long the standards will take to work their way through the system).

Top of mind is the nag that the standards will fossilize the late 20th century approach to planning and resource management and slow the pace of innovation. Not many look back at the 1954 model town and country planning regulations as being the high point. But perhaps some do. If planning stopped at that point, there may not have been the creep seen since. Equally, many important developments around landscapes and environmental enhancement may not have proceeded. So all depends upon
your perspective.

I wonder if the real purpose of the standards is not to make plans easy to compare or navigate.  Are the Standards more to do with what should be in and what should not be in plans, with the emphasis on the later? Some parts of the standards could be said to be helpful, in that plans have to explicitly tackle some issues; plans cant dodge them any longer. The requirements to be explicit about tangata whenua issues and aspirations, for example. Same comment could be made about Outstanding Landscapes or urban capacity. But do we need a standard to do this? Didn't there use to be a Schedule setting out what plans should do?

The bigger question is what the standards leave out, or will stop from being included in plans in the future.  Being a rigid formula that cant be changed, it is almost like the standards have introduced by stealth an 'anti Section 6' into the RMA - "it is a matter of national importance that plans must not recognise and provide for the following (unmentioned) things....."

How do the standards get updated? What if someone comes up with a brilliant new zone through some sort of fantastic consultative, collaborative process  - the Minister has to approve it? So much for devolution of decision making.

The standards feel like they come from the ‘good housekeeping’ school of planning - "when putting the washing away socks and undies go in the top two draws, T shirts next draw down, then sports gear, then jeans and other trousers in the bottom draw". Just stick to keeping things nice and tidy, easy.

Not much about inclusive, sustainable urban environments. Nothing about the next urban age.

On the positive side, the Standards may well just end up driving the development of more placed-based, better calibrated local area plans. The district plan standard allows for ‘precincts’, so I guess the way out of the straight jacket of the set zones is to call everything  ‘Precinct XYZ or Precinct ABC’. Effectively the Auckland Unitary Plan is a bunch of precincts masquerading as a zone-based plan. This may mean more complex and hard to understand plans, but then for every action there is a reaction, so what do you expect.

A few more detailed thoughts.

Regional Policy Statements

Where is the urban “bit”? Under special topics?

Given that managing urban growth, including coordination with infrastructure, is a regional council function, and one central to Auckland, Wellington and Canterbury Regions (and even Otago these days), you would think an RPS would be allowed (even required) to have a chapter on urban growth management. Perhaps it is all dealt with under the National Policy Statements section - NPS UDC.

District Plans

How many layers to a plan?

The standards provide for 7 'spatial' tools (zones, overlays, precincts etc). This allows for plenty of flexibility in format, which in practice is likely to make plans 'incomparable' with one another.

Having said that, the layers seem to get tied to certain things. Overlays can only deal with district wide matters, by the looks of things. This seems a bit restrictive. If you want some sort of  layer that cuts across two or three zones (like a road corridor that traverses residential and commercial areas) where there is scope to free things up, how do you do that? Is that a Precinct? Why can Precincts only be used where two or more provisions are amended?

What is not mentioned is the relationship between the layers - do some layers trump other layers for example? Despite best efforts, there is always overlap with these layers and the Auckland Unitary Plan is replete with confusing relationships between layers. It is often not clear if overlays and precincts replace zone provisions, or are in addition to them, for example. If the layers pull in different direction, what gives?

More district-wide matters?

Having a bunch of district wide matters is one way to simplify a number of zones and precincts. The list of matters set out in the Standards feels too limited:
  • Where does ‘transport’ - parking and access and all that - fit in?  
  • Urban design? Some plans experimented with a single urban design ‘code’ (or set of principles / criteria)  that all zones referred back to as relevant, rather than repeat material through each zone. 
  • Same idea was applied to Crime Prevention Through Environmental Design in a number of plans.
  • What about if the Plan has an affordable housing requirement in it, that applies across the zones?  
  • And what about if plans introduced some sort of city-wide green building standard to help improve energy efficiency, reduce green house gas use, minimise waste and manage stormwater on-site?
  • Does wind assessment for taller buildings have to be repeated in each zone that allows for buildings over 20ms in height? 
  • And what about 'character' areas - not historic heritage as such, but areas with recognized character that is worth managing.  Or is this a 'precinct' matter. I get a bit lost. 
The sub-text seems to be that plans shouldn’t have this fluffy stuff in them.  Just stick to the knitting.

Pick and mix zones

The zone standards are odd creatures. The residential zones refer to density, when the real issue is built form. Height of buildings may be a better metric than density. The purpose statements refer to ‘suburban’ and ‘urban’ character.  Yikes.

What happens if a community want a 'bush living', 'coastal settlement' or 'inner-city' residential zone, something a bit more evocative of the purpose of the zone. I guess you could add some words after the most relevant standard zone to get around this. Is there anything stopping a plan saying: Residential ( xyz ) zone?

At some point in the not too distant future, I think building height and form will start to be set out in a block-by-block way, yet activities will be managed area or city-wide. Do we need just one residential zone to manage activities, but room for a range of spatially defined built form outcomes that are a lot more nuanced than four zones?

Same idea for commercial zones - do the range of activities in commercial zones vary that much? What does vary is built form. By the way, I notice that there is no zone for 'large format retail' AKA big boxes. This may be a blessing in disguise. Perhaps that wave of development has blown through. A similar comment can be made about 'Business Parks'.

What to do when the plan goes quiet?

Of course the real ‘meat on the bones’ are not in the Standards. What the built form could be or should be for a residential or commercial zone is not set out, for example.  Most importantly is the task of assessing developments that step outside the standards for a zone - what is acceptable / appropriate in the context of the site and the environment, what is not appropriate? Increasingly plans are opening up this 'discretionary' space, but not providing much guidance on how much is too much. To me this is where a standard, if there is one, should head.

Back to 1954 Regulations

Having said that nobody wants to go back to the 1954 model regulations, interestingly these regs did have some components which are now considered 'innovative':

The Residential A zone allowed for:

(a) Dwelling houses;
(b) Semi-detached houses;
(c) Apartment houses containing not more than two household units.

The above pretty much covers the normal building typologies with a similar outcome.

Apartments with more than two household units and terrace houses with up to 6 units with rear vehicle access were conditional. This allowed for site by site assessment.

Did they knew about urban design back in 1954 (with terraces having to have rear access!)?

Height for all residential buildings was limited to 30 feet or 9 metres.   Height was the defining characteristic of the zone, not density as such.

In the Residential A zone non-residential buildings like churches could go to 40ft or 12 metres.

A bit of variety of height is not a bad thing - 3 storeys can sit easily beside 2 storeys. I think corner sites could take taller buildings.

The Residential B zone  allowed for dwelling houses, semi-detached, terrace and apartments. Apartments could go up to 104 ft - 31 metres as a conditional use.

The B zone set a range for heights - a permitted height and a maximum height. Having a discretionary range is quite a good idea, I think

The maximum height was quite substantial. Did they know about urban capacity issues back in 1954?

Friday, 20 July 2018

New urban agenda 3: What’s next.

Back to thinking about the next phase of urban planning.

In some of my blogs I have tried to think a bit about what is around the corner for urban areas and urban planning. In past blogs I have set out my thoughts on the Productivity Commission's’ report on better urban planning. Like ageing generals who train to fight the next war based on the techniques that won them the last war (and who don’t recognise that technology and tactics have changed), the Productivity Commission’s take on cities and planning seems old hat. Armed with the concepts that swept the western world in the early1980s, they hope to reform the final bastion of 'central-planning', namely urban planning.

Their analysis rests on the classic economic view that planning’s role is to enable agglomeration economies while managing the downside of negative spillover effects generated by urban intensity (such as congestion and poor urban design). But overlaid with that approach is the neoliberal criticism of planning being unable to effectively manage the growing complexity of cities. Only free markets can mediate between the needs of many diverse consumers and producers. There is no one vision that can prevail. Finding consensus is an illusion. A planned allocation of resources is impossible.

In the town hall of Sienna, Italy, there is the fresco: Allegory of Good and Bad Government. The good government fresco shows that if government is virtuous and rules justly, then the city thrives and prospers.  Bad government, and the city suffers. The 'bad city' fresco has a decaying, cramped appearance, while street crime is clearly visible. Outside the city, the 'bad countryside is marked by burning farms, disease and widespread drought.. The fresco was painted in the 1300s.

In the fresco, the virtues of Good Government are represented by six  figures: Peace, Fortitude and Prudence on the left, Magnanimity, Temperance and Justice on the right.

Are cities and their effective management that different today from the 1300s? Interesting how the virtues of good governance require a mix of  actions - fortitude and prudence, for example. Those values are probably timeless, but what does change are the tools of trade.

You could say that the last 20 years has seen the ‘market’ as the primary means of determining resource allocation -  the market has been used to mediate between competing visions, values and outcomes and the market has determined the winners and the losers. But the number of losers has started to mount. As a result, there is a shift underway back to a bigger role for the state and more of a planned allocation of resources. This is to address issues like education and inequality, but also to address long run, entrenched problems like climate change and obesogenic environments - things that the market approach cannot tackle well. Overlain with this is a growing concern that current means of economic management are no longer up to the tasks of dealing with technological change. As Adair Turner puts it in his great analysis: Capitalism in the age of robots: work, income and wealth in the 21st-century:

It is likely that we are in the early stages of a technological revolution which will eventually result in the automation of almost all economic activity, almost all work activities. When considering automation potential, the question is when, not if.

The implications of this revolution is a split between a few involved in the on-going development of technology and the many involved in delivering a range of non-technology based social and consumption led services to the few technological elite, as well as to each other. This may be the world of a few high skill / high pay jobs and many low skill/low pay jobs. In Turner's view, increased productivity that can lift all incomes is unlikely - improved productivity from technology gets swamped by the growth of low paid service orientated jobs.

Whats more, in this new economy, land becomes an important means of storing wealth and generating income:

In a world where all goods and services can be produced at ever collapsing prices, the relative value of desriable things which are inherently uncreated, such as land in desirable locations, will almost inevitably increase. 

Interestingly, Turner sees urban planning as one means to address the resulting consequences of highly uneven patterns of  income and activity:

High quality urban development. Macro and micro economists often pay little attention to
the physical realities of spatial development, city design, architecture and transport
systems. But in a world where land located in desired locations is likely to account for a
rising share of all wealth, and where, as Tyler Cowen has stressed, the cost of housing and of
commuting is a crucial driver of adequate living standards, the geography of economic
development plays a vital role. The more that we can make multiple cities attractive places
to live, and multiple areas within each city attractive, via good public transport, attractive
public spaces, and the provision of high quality cultural and sporting amenities, the more we
can mitigate, at least to some degree, the intensity of competition for the positional good of
locationally specific real estate.

The function of urban planning and management is likely to grow more complex in this context. It is not just about separation of incompatible land uses and reducing negative spill over effects (which may become significantly reduced as a goal as technology gets better); rather will urban planning increasingly become focused on ensuring a diversity of land uses and activities within each area of the city  and across regions (inclusion, not exclusion)?

Rather than  government's reaching for the cheque book to promote inclusion (which may prove difficult in an environment of limited income growth), I think the forthcoming period will see the government try to harness private capital to achieve social ends. This means the state providing some certainty over land uses and development timing to deliver a return to private capital, with part of that return ‘taxed’ for pubic benefit. But in providing that certainty it will be important that the essential qualities of an inclusive, adaptive and resilient city are not lost.  Planning will have to keep both the public and private sectors ‘honest’ in their dealings with the city.

So, are we about to enter the city of the early phase of the sixth kondratieff wave or the fourth industrial revolution? As with previous waves and revolutions, change is likely to be fast and hectic in the first phase.  This will be the city of artificial intelligence, automation and bio technology.  What may be some of the drivers of urban development and urban management?

Improved mobility

The two great drivers of urban form over the past 50 years have been the car and the lift. The car allowed cities to spread outwards, while lifts allowed cities to grow vertically. Technology will advance both. As electric, driverless cars take hold and driverless public transport becomes more common (and therefore cheaper and more frequent); couple both with mobile technology and it may well be that the next new workplace is the car, bus or train. Replace the one hour commute with the one hour work session and maybe the city will disperse and expand some more. Equally much freight and heavy vehicle movements could occur at night, out of peak periods, lessening the need for expensive projects like the ill fated East-West Link in Auckland.

Lifts are likely to get cheaper and may be able to better serve both vertical and horizontal arrangements of apartments and workplaces.  Bring down the cost of lifts and 4 to 6 storey apartment developments with only a few units on each floor  may become more affordable and desirable (no need for a large block of apartments ). This building height retains liveable streets and provides for a sense of connection between a living area and the street and gardens that people like, but suffered in the past as it involved either too many stairs to climb or an expensive lift only justified by long corridors of units served by one lift core.   Link that apartment with a horizontal 'lift' to a centralised car parking building and more space comes free.

Governments strapped for cash.

As demands  on public spending rise while the ability to raise taxes stalls, it is inevitable that governments will look for means of spreading the load. This can already be seen in housing and urban infrastructure. In both spheres governments have been looking at how the private sector and or the third sector can take on more of a role in the provision of social and affordable housing. Urban infrastructure will shift to a user pays approach. The outcome is likely to be a good supply of housing and infrastructure is some areas - areas that can support the cash flow required to fund the houses, pipes and roads, but limited provision in other areas, where cashflow will be more restricted. How can we cross subsidise?

International labour markets and automation.

The gig economy is kind of here already with the growth of the professional, scientific technical services sector. Automation and technology may strip out many stable, middle income jobs in the banking, insurance,  finance  and administrative sectors - the mainstay of urban economies.  An important question will be the extent to which uncertainty over long term income generation potential for people and households will translates into different forms of housing and ownership tenures, especially given the need for the market to have certainty over income streams if it is to take on a bigger role in housing and infrastructure. The short term is likely to ever more dominate decision making.

Asset inflation.

Price inflation seems to have taken a long holiday after the inflationary periods of the 1970s. Some say it is permanently on holiday. Wage growth also seems to have stalled and many households have run out of options to increase incomes - most households now involve multiple full time workers while debt has built up, when back in the 1950s, households only needed one income and not too much debt to afford a house.  There are now no other options for households to generate more income (except perhaps sending the kids out to work).

What seems to have replaced price inflation is asset inflation. Low interest rates and monetary easing has created strong pressure for investment in assets like property and shares. Housing (or at least the land on which housing sits) has become a commodity, traded often. Quick turn around suggests cheap and cheerful design. There will be some demand from the likes of Iwi, community-based organisations and some wealth funds for long term holdings of land and buildings, which suggest a demand for quality, but that may be the minority.

It used to be that land was one of the three factors of production - land, labour and capital. At some point land seems to have reduced in importance and perhaps will become totally redundant as a factor of production in a knowledge economy. Land seems to have switched from an input into a bigger process that generated wealth to being a repository for the wealth generated by a bit of labour and some capital.  The more rapidly information and communication technology progresses, the more that wealth and income derive from inherently physical and subjective assets, such as land, brands, or beauty.

Environmental hazards.

Quite a bit of rejigging of cities will be needed as climate change strengthens - low lying coastal areas will see disinvestment and gradual retreat. Flood plains will get more frequently inundated. Steeper hillsides may be more prone to slips. In all cases  development - existing and future - will get displaced. As insurance gets more expensive and harder to obtain, dis- investment will be more common in some areas 

City as a social exchange

Above all, cities are increasingly about social interaction and exchange, rather than just economic exchange. Mobile technology seems to accentuate the ability of people to interact, to meet and converse. Add in the growing number of retirees and workers in the gig economy between assignments and the demand on freely accessible urban public spaces is likely to grow strongly.  Every neighbourhood will need to its local ‘hub’.

So what are the implications?

Cities need to refresh themselves constantly, nevermore so at a time of rapid technological change. They need some ‘slop’ in the system to enable decline and redevelopment in a way that does not result in abrupt and substantial disruption and displacement of existing communities. Part of the problem Auckland has is that its buffer of ‘redevelopable’ areas is limited. 

But cities also need diversity and equity of opportunity so as to respond to social and economic pressures. They need safe and vibrant public realms to support social interaction,  an urban fabric that lowers the entry costs for new businesses and enterprises, but also positive assistance to build in diversity into each neighbourhood.

Left to themselves city growth and development can quickly become uneven and unaffordable, and the above trends could speed up that process of uneven, expensive (or often ultimately dead end) development.  Market-led urbanism will not deliver choice and diversity:
  • Too many shopping malls and not enough local shops 
  • Too much gentrification in some areas and too much decline and disinvestment in others
  • Too many big office buildings and business parks and not enough small, flexible and cheap work places
  • Too much cheap and cheerful design.

Above all, cities need diversity and choice and that diversity and choice needs to be built into the urban fabric. ‘Public private partnerships’ will be the common call to achieve this. To enable these partnerships, precinct and area based plans will take over from city-wide plans, with these place-based plans based on and building in a series of transactions over use and delivery of space and resources. As big data takes hold, there will be the ability to develop finely calibrated local area plans that speak more of volume, form and interfaces, than zones and activities. Deal making between public and private capital will be more prevalent, but within a framework of checks and balances. Some form of arms length, independent planning commission will be in place, but with oversight from an audit body, as trade offs and transfers from one area to another become more common.

And could those planning functions be administered by a machine? Quite possibly.

Note 1:

http://cms.ineteconomics.org/uploads/papers/Paper-Turner-Capitalism-in-the-Age-of-Robots.pdf

Tuesday, 3 July 2018

In praise of planning blight?


Time for a bit of idle thinking.

The decay and deterioration of an urban area due to neglect, crime and old age (urban blight) is generally held to be a bad thing. One of the functions of urban planning used to be to arrest and hopefully prevent urban blight from taking hold. The certainty over land use futures provided by planning and the management of negative spillover effects from new developments helps areas to resist the pressures of dis-investment and decay associated with blight.

Planning has sought to reduce the adverse effects of blight on urban neighbourhoods as there are a bunch of social and economic consequences for those 'left behind'.  Some of the early attempts at solving urban blight by public sector-led redevelopment ended up adding to urban blight. Overtime the emphasis has shifted to providing certainty to the property market by zoning. But has planning done too good a job? Is a degree of  blight a necessary condition for cities? While an area of the city gripped by urban blight is to be avoided, do cities need a bit of blight from time-to-time for city development markets to function?  Sometimes, places need to decline before they can redevelop.

Urban blight's cousin - planning blight - is also considered to be a bad thing, perhaps more by association than in actuality.  Could planning blight be a milder form of urban blight that helps along  the process of decline then rejuvenation? Planning blight has been described as the reduction in property investment and upkeep due to anticipated future rezoning. Sometimes planning blight can also be associated with designations for future public works that are not implemented for a long period of time. 

There is clearly an issue with regards to how Auckland is to redevelop and intensify, as there is with many first world cities. The easy options to accommodate growth have been used up, largely. Outwards expansion of the urban area is now costly and much less attractive than it was even 20 years go, given increasing length of commuting times back into main employment areas. Within the city itself, most easy infill type options (add a unit to the back of a section) have been taken up. 

Redevelopment is needed (scrap off and start again). Add in geographic constraints and community opposition to change and the pressures on the urban area mount. But redevelopment (apart from government-led projects like Tamaki and Hobsonville) appears costly and complex.  This is at a time when most commentators want the private sector to take up more of the slack with regard to house construction.  

Generally conditions for redevelopment are favourable when then is growing demand, zoning is enabling, existing development is getting old and worn out and the area is due to move up the urban density ladder. The ratio between land values and improvements (buildings) needs to be low (for example where land makes up 70 or 80% of the value of a property) for redevelopment to be viable. Older development is the most fertile ground for this type of ratio, but a small house on a big, expensive section is also likely to have a low ratio between improvements and land value.

However, is it just old development that is ripe for redevelopment?  Does there also need to be some uncertainty about where the area is heading for redevelopment to work? Older areas may just gentrify - for example the 'doer uppers' will move in and improve the old stock, rather than redevelop. Equally, signs of a turnaround in fortunes for an area may see current landowners sit on their land, reaping value increases. Why sell, unless the offer is huge? But if there is some uncertainty about the future of an area, then current landowners may be wanting to 'get out'.  

At least some of the old drivers of urban redevelopment that helped to create uncertainty  (and with it, urban blight) seem to have dropped by the wayside:

  1. Absolute poverty is less of an issue that it used to be (so 'slums' are no longer an issue)
  2. Economic conditions seem more stable, with the 'ups and downs' less pronounced than they might once have been
  3. Building standards are much higher and so buildings do not deteriorate as fast as they used to
  4. Industry is not longer dirty and smoky creating pockets of lower value areas in their vicinity.
Disasters are also a good precursor to redevelopment, but are not to be encouraged. NZ is free of military conflict, while widespread urban fires are a thing of the past; but we do, however,  have natural disasters.

In the past, these types of forces may have created a degree of uncertainty  in urban environments. Areas often need to go down before they came back up. Redevelopment was a natural process that followed decline, with risk taking developers (perhaps) the first movers into areas that have been left behind. Owners and investors would follow. Through this process of decline and renewal, new housing stock is added.

Since about the 1970s and this process seems to have been halted. Partly this is through gentrification and heritage protection. It may also coincide with planning  bringing a lot more stability to the urban property market.  

Some redevelopment has occurred within industrial areas close to the central city of Auckland, with apartments replacing industrial units.  Why there? Did uncertainty over future business demand for inner city industrial sites start to see some industrial landowners question whether holding onto land was a good idea?  Did some uncertainty creep into the market - 'better get out now'. At the same time that uncertainty created an opportunity for others to exploit. Developers did not have to compete against residential investors or owner-occupiers to buy land, as most would-be home owners and residential investors would not look at industrial sites. Demand for apartments  in industrial areas may have been uncertain, but for some the risk was worth taking (but has some of that pressure for redevelopment fallen back as industrial land values adjusted to the prospect of higher returns from apartment development?)

The question is what to do, if some of the old drivers of redevelopment are absent?
One reaction is the call to open up the city land market to much more 'competition'.  This is essentially the approach of the National Policy Statement on Urban Development Capacity. If most sites in the city could be redeveloped in some shape or form, then there must be some 'willing seller' options for developers across a city. At its simplest, if 5% of landowners actively want or need to sell and move out at any one time, then the bigger the pool of potential sellers, the more competition facing those who want to or need to sell. I don't know if 5% is the number.

However this strategy is all a bit scatter gun in its application, which makes infrastructure planning much harder and infrastructure upgrades more likely to lag development.  It is also relies upon making the redevelopment 'balloon' as big as possible in the hopes that within that balloon there will be a few folk who, for whatever reason, need to sell to a developer. But the bigger the balloon, the more the plan has to work hard to ensure that new development blends in with existing development - it is not really possible to identify areas of change if most of the city is up for change.  Hence the extent of change possible is often quite modest in its form to placate the locals. There will also be a bunch of people chasing the properties for sale - owners, investors and developers.  Generally owners and investors will out bid the developer. There is not necessarily much uncertainty as to future conditions to exploit.  

An urban redevelopment agency might be another tactic, one the Labour-led government is thinking about.  In the past such agencies have been used to help stimulate redevelopment of declining areas; to help accelerate the process of rejuvenation.  Most often this involved taking an area that had declined and adding dollops of public money to engender some confidence.  In a world of more limited public money and the need to redevelop existing stable areas, do such agencies need to be recast? Do they need to (somewhat contradictory) focus on the down side rather than the upside of cycles of urban change?

The other option is for the developer to test the boundaries of possible development on a site; to work through the consent and/or rezoning process to create a gap between a property's current value and what may be possible on a site.  That is, to exploit planning's scope for flexibility. This tactic creates the endless fun and games of the RMA process. It also creates an incentive for the developer to 'bank' the consent and sell the site, rather than bank and implement the consent. 

In this context, is there a role for planning to actively 'de-stabalise' some areas to help start a process of decline then rejuvenation?  Is planning blight actually a good thing?

There is no definition of planning blight. Generally it is taken to mean uncertainty and limited investment in an area due to uncertainty as to zoning and associated development. If landowners think there are zoning changes in the wind, then they may sit on their properties, not wishing to develop them until the future is clearer.  This may help generate the conditions for redevelopment. 

Another small example is the fringes of Takapuna. For a long time through the 1980s and 1990s, it was thought that Takapuna would expand - workplaces would grow and more shops develop. Residential landowners on the edge of the centre sat on their hands and hoped that the commercial centre would expand outwards towards them, raising the value of their properties. No point developing the section, just wait. A form of benign blight set it. But as the 1990s rolled into the 2000s, Takapuna's growth stalled. Other centres developed (like Albany), workplaces located elsewhere like Smales Farm.  At some point, landowners started to wonder if the centre was no longer going to grow. As time marched on they also wanted to realise their asset. So redevelopment into apartments began to look like an option. The rundown nature of some of the housing, plus rising land prices driven by Auckland's overall growth  changed the dynamics. A zone change to allow higher rise development was prepared. Opposition was limited. Now some apartment developments are mooted. This has been a 30 year process of hope, uncertainty, decline and a change of thinking.

Planning has kind of enabled this process, in a funny way. Identification of Takapuna as a sub regional centre helped fuel hopes of commercial expansion, while a tight rein on that commercial zoning helped to generate higher values within the centre and therefore a degree of hope on the edge of the centre that at some point these values would expand outwards and a reward for waiting would be obtained. But as hopes of commercial expansion receded, talk of apartments and rezoning facilitated a change of attitude.

Is this a small example of what needs to happen across the city in many areas and pockets?  Do we need to generate some planning blight to help facilitate urban change?   The possible expansion then contraction of retail and business areas seems a likely candidate. 

What would be a example of a plan-led approach? Do we need an suburban version of a greenfields 'future urban zone'? Large areas of greenfields land are zoned future urban so as to protect the land resource from incremental subdivision and development ahead of urbanisation and to ensure that when the land is urbanised, it is done so efficiently and effectively. There is a degree of blight associated with this process as landowners await rezoning from future urban to a live urban zoning. The costs of this blight are considered to be acceptable given the benefits of the comprehensive approach enabled. Would a suburban version be a good idea? Would a 'future, possible intensive mixed use zone' applied to areas like future LRT corridors be a helpful tool? Or should we encourage retail areas to expand, or hope to expand, in the knowledge that over time retail will wax and wan, opening up opportunities for alternative uses around their fringes? 

Monday, 4 June 2018

Submission on transitioning to low emissions city report

The following is my draft submission responding to the Productivity Commission’s report ‘transitioning to a low emission economy’. It follows on from my last blog in which I set out a few initial thoughts..

The main issue I have with the report is that much greater attention needs to be paid to how cities can transition to a low carbon society. I make no comment on agricultural emissions and the associated issues.

Put simply, transitioning to a low emission city must be the objective.

This is because of the following:

1. most people live in cities;

2. cities are path dependent; they are slow to adapt to changing social and economic forces;

3. NZ cities have grown in the post war ‘carbon-intensive’ period, where land use and infrastructure patterns and services reflect low energy costs

4. changes to carbon prices to reduce or eliminate greenhouse gases will  increase costs faced by households and businesses; they have to face increased costs if they are to change behaviour and adopt different technologies sufficient to reduce climate change;

5. moreover the price signals needed to achieve low emissions appear to be ever increasing as action on climate change is delayed, while potential substitutes have a degree of uncertainty as to their efficacy. Reliance on forestry to soak up significant greenhouse gas emissions may not prove to be so effective. Hoped for technological innovations like widespread use of electric vehicles and neighbourhood scale batteries for electricity storage are not certain outcomes, meaning there is no easy transition to transport and energy services that are cheaper than carbon;

6. higher transport, energy (and food, infrastructure and ‘waste’ disposal) costs will affect household budgets. In turn, those costs will be reflected in peoples’ and businesses’ locational choices, making some areas in cities more attractive and other areas less attractive, both central and peripheral areas;

7. there is a significant prospect of large populations being disadvantaged due to the ‘lock in’ of existing urban forms, leaving households in some areas to face much higher costs for transport and energy, but also potentially higher costs to cover infrastructure and utility services, but without the ability to take compensating actions;

8. Significant actions are needed now to help urban forms to adjust, both incrementally and radically, to changing social and economic patterns arising from high carbon prices.

The Commission’s findings

It is helpful that the Commission has considered the role of the built environment in the transition to a low carbon economy. However its consideration seems to have been from only one perspective - the potential for changes to urban form to drive carbon reduction. The following findings and recommendations are made with respect to the built environment:

F15.1 Increasing the price of emissions in the New Zealand Emissions Trading Scheme is the most effective way to incentivise a transition toward the construction of buildings with lower embodied emissions. 

F15.2 Increasing the density of urban areas, combined with good public transport and accessibility, can reduce vehicular travel and emissions. But intensification of this nature has proven difficult to accomplish and runs counter to the living preferences of many New Zealanders. Urban planning policies are likely to take many years to achieve significant increases in density. By then, reductions in vehicle emissions may have already been achieved through advances in low-emissions transport. 

These findings follow an economic 'text book' approach and hold true if a number of assumptions are made. As one economic study puts it (note 1):

If emissions are actually taxed at the appropriate rate then there is no need for further spatial policy to improve private decisions about location. Second, if emissions are taxed below the optimal level, then it is appropriate to subsidize the areas that have less energy usage and tax the areas with more energy usage. Third, even with an optimal emissions tax, suboptimal public policies, such as zoning or transport subsidies, may still lead to suboptimal locations. 

Sounds easy, and the Commission’s report appears to make the same assumptions. But …

There are many imperfections in peoples’ and businesses’ locational decision making which suggest that a carbon charge will not automatically result in households and businesses finding their least cost locations. There are many inbuilt inefficiencies in cities that are likely to distort price signals.

The dismissal of urban planning as a tool to drive carbon reduction in areas of a city with high emission patterns is dependent upon the right tax policies being in place. This is a big assumption and until the right tax is in place, planning should not be put aside as a tool, especially where planning policy achieves multiple benefits and even if planning tools are slow acting.

The last point noted – the ability of households and businesses to adjust their spatial preferences due to ‘barriers’- is not investigated by the Report.  Changes to household budgets are noted, but not the aggregate situation for a city as a whole. In other words, question of how urban planning and infrastructure funding and spending will need to adapt to high carbon prices is not addressed. This has to be much more than the normal calls to ‘remove barriers’ and ‘speed up processes’.

In terms of the recommendations listed in the Commission's report, while possible changes to the Building Code are identified, there are no similar changes recommended to the Resource Management Act, Local Government Act or Land Transport Act, for example. Perhaps the Commission is relying upon its other reports on urban planning and land for housing to address the issues faced by urban areas as they respond to higher carbon prices (and faster climate change). But that is not stated. Or it may be assumed that the Commission only sees minor or small changes to urban areas. Certainly the report suggests wide take up of electric vehicles, limited changes to electricity prices and other (unspecified) innovations as being possible. All suggest business as usual for cities under a low emission framework. But is this more hope than reality?

There is a disconnect between the statements at the start of the report about the scale of the challenge faced by society, and the actions noted for households (which all tend to suggest, for households in cities at least, business as usual).

And cities matter to the required transition; there are differences between cities in terms of carbon emissions which suggest city land use patterns are important. The graph above is a 2007 estimate of annual carbon emissions per dollar of household expenditure, by region. Wellington has the lowest per capita emissions, Christchurch is higher.

In short, urban areas will need to adjust, and the higher the carbon price, the faster and more radical the likely change. Anticipating and co-ordinating this change to urban areas will require substantial effort. There is the possibility of increased urban consolidation, but an ex urban form of growth is also possible as distributed forms of infrastructure take hold. Both outcomes are possible, and resolution as to where most planning effort should be placed, is needed.

To my mind, additional or alternative findings and recommendations are needed covering the following:

Findings

Until a full carbon ‘tax’, ‘charge’ or similar is in place, then urban planning does have a role in reducing pressures for spatial development patterns that are dependent upon high carbon inputs and facilitating and enabling development is areas that reduce or have below average carbon footprints. 

Urban settlements face significant challenges in adapting to a low carbon economy, having been mostly built during a sustained period of high carbon availability / low energy costs. Path dependency and lock in of inherited urban forms represent a major block to required transitions and will need positive actions to overcome.

Recommendations

The government needs to develop tools and techniques that will allow for well-designed adjustments to urban form and infrastructure. This must involve co-ordination between land use and infrastructure planning, including soft or social infrastructure in areas of change

There is a need for strong signals to be delivered to the development market now as to future urban forms compatible with a low carbon economy, given the likely staged implementation of higher carbon prices and the uncertainty over possible soft adaptation measures, plus the long lead times between planning and urban development.

Funding mechanisms must be available so that the winners from the transition to a low carbon economy can help compensate the ‘losers’. Significant areas of cities could be left behind, with many households and businesses ‘trapped’ in suburbs that are costly to live in and ever more costly to ‘run’.

The target: some emissions, low emissions or no emissions?

The Government has committed itself to a zero carbon future, kind of. It plans to introduce a new Zero Carbon Bill in 2018 which seeks to set a new emissions reduction target by 2050. There seems to be a bit of a difference between zero carbon and ‘low’ emissions. I am not quite sure what low means, but never mind. I guess the direction of travel is clear. The method of travel – a carbon charge via the ETS or a carbon tax- also seems clear.

But how far and how fast the rate of travel down the no/low emissions path does matter, and that rate of travel is dependent upon what level of carbon charge is imposed.

There is no clear statement as to likely carbon prices and hence price adjustments that urban businesses and households will face. Yet understanding the extent of change likely to occur clearly rests with the price needed to reduce greenhouse gas emissions.

While there is always a degree of uncertainty, the Productivity Commission's report seems to hedge its bets. For example:

“Modelling and other available evidence suggests that New Zealand’s emissions price will need to rise to levels of the order of $75 a tonne of CO2 equivalent (CO2e) and possibly over $200 a tonne over the next few decades to achieve the domestic emissions reductions needed to meet New Zealand’s international commitments. 

New Zealand could also reach net-zero GHG emissions by 2050 with emissions prices rising to between $157 a tonne of CO2e and $250 a tonne of CO2e by 2050 (with the higher figure assuming that technological change is slow)”

What does seem to be the case is that every years delay in imposing an appropriate carbon charge results in higher and higher estimates of the required carbon charge, as the time to transition to a low carbon society shrinks.

A realistic (not too hot, not too cold) price signal needs to be set now.

Uncertainties over pathways

The report states that the pathways to a low emission society rely on three key drivers: the expansion of forestry; the electrification of New Zealand’s transport sector; and changes to the structure and methods of agricultural production.

But each of these ‘pathways’ have risks and uncertainties associated with them.

Expanding forestry is central to achieving large reductions in emissions up to 2050. Yet, the heavy reliance on forestry will create challenges in the short and longer term. In the short term, major land use change is needed, while in the long term – with continued emissions reductions required after 2050 to maintain net-zero - an alternative to forestry will be required.

Electric vehicles are seen as offering some of the most promising mitigation opportunities for New Zealand, but their uptake faces barriers, which are identified as high prices relative to fossil-fuel vehicles, anxiety about their limited travel range, and poor public understanding of their benefits. Significant upgrade of the local electricity network is also needed to cope with widespread charging. New EVs can be $15,000 more expensive than similar petrol equivalents, which also means that second hand EVs are more expensive than their petrol equivalents. However prices will come down, over time.

To address these barriers, the report suggests that the government can offset some of these barriers by  introducing a ”feebate” scheme, through which importers would either pay a fee or receive a rebate, depending on the emissions intensity or fuel efficiency of the imported vehicle;  providing funding support for electric vehicle infrastructure projects, to fill gaps in the charging network that are commercially unviable for the private sector; and  raising awareness and uptake of low-emissions vehicles through leadership in procurement.

These are not minor or cheap actions and it is questionable as to whether public money should be used to subsidise a private good, rather than support a public good, like improved rapid transit services. In addition, some other method of funding transport projects from EV use will be required, as fuel excise tax reduces in relevance.

The implications of these pathways not being realised as fully as hoped, are not explored.

The other pathway, electricity generation, is not available. Shifting electricity generation to a low carbon pathway does not seem to figure, with 80% of electricity said to be from renewables, with the last 20% hard to close due to winter peak demands and the potential for dry years affecting hydro generation. But only 50 to 60% of electricity generation is actually carbon free, according to Vector.
Yet to avoid generating more greenhouses gases from the likes of gas powered plants to cover peak periods or dry years, electricity prices will need to rise to help reduce demands. Calls for variable pricing to help moderate peak demands will impact upon households.

Presumably the only outcome if the different pathways are only partially able to be followed is every higher carbon prices as the government seeks to limit greenhouse gas use.

Effects on households

The effect on households of higher carbon prices are not well understood or explored. It appears that the Commission have assumed that the changes to transport, energy and food costs will be minor, with the above pathways in place.

The report does provide the following:

Previous modelling and empirical studies have estimated the possible impact of emissions prices on fuel and electricity prices.  Infometrics (2017) estimated that a NZ$100 a tonne emissions price would raise retail petrol prices by 28 cents per litre.  Stevenson et al. (2018) investigated the impact of rising emissions prices on the electricity market, and found that annual average wholesale electricity prices rose from around NZ$80 a megawatt hour (MWh) at a NZ$20 a tonne emission prices to just over $100/MWh at a NZ$80 a tonne emissions price. 

Quite what that means for households is not clear, especially if carbon prices closer to the $200 per tonne mark are needed.

The Ministry for the Environment, as part of its 2016 review of the ETS, estimated that if the carbon price rose to $20 a tonne, petrol costs for the average New Zealand household would rise by around $58 a year and power bills would rise by around $64 a year. If the carbon price rose to $50 a tonne, petrol and electricity prices combined would rise by $6 a week, or around $300 per year.  The following figures were provided (note 1):


This doesn’t sound too bad.

But what if carbon was $150 per tonne? The above figures suggest a figure closer to $1,000 per year.

If the $150 per tonne charge did raise petrol costs by about $300 per year, then to maintain a ‘petrol budget’ the same as before the extra charge, average distance travelled per year, per car would need to drop by about 10%, or 1,200kms, all else being equal. This is an average of 6km per working day. In theory, households would seek to move 3kms closer to work to avoid the extra charge, but may have to accept living in a smaller house, or on a smaller section than their current arrangement, to avoid paying more than the value of the house that they currently occupy.
Even if public transport services step up to ‘fill the gap’ left by higher private transport costs, the above calculations still hold true, as public transport trips generally take longer to complete than equivalent private car trips.

These averages will ‘hide’ the extent of change needed for some households.

While on-the-one-hand it is understandable, to help facilitate the necessary transition, for the Commission (and the government) to say that the shift to a low carbon economy will not result in big changes to costs faced by households, it is on-the-other-hand potentially damaging to any transition to understate the potential effects and consequences. Some realistic analysis is required.

Taking action now on urban form.

It is commonly held that urban form changes only slowly. Indeed this is the reason that the Commission finds that urban planning should not force reduction in carbon use. Rather urban areas should be left to adjust to changes to carbon prices.

This approach, however, does not recognise that potentially slow and incremental changes to urban form could be a significant drag on adaptive changes, significantly increasing transitional costs to households and businesses. This is because of the in-built ‘momentum’ of cities. Addressing this issue is fundamental to adjusting to high carbon prices as most people live in towns and cities. It also has to be more than just a call to speed up urban planning processes to better cope with ‘consumer-driven’ changes.

To take the example of transport, the report does acknowledge that ‘future land transport policy should put emissions-reduction goals more centrally in government planning, adopt a more mode-neutral approach to assessing and funding new projects, and make greater use of demand-management techniques such as congestion pricing’.

First up, these actions suggest a degree of push back to the use of EVs and an associated contrary move to the hoped for public support for the take up of EVs. There is still congestion to address, for example. Even then, is a mode neutral approach sufficient? If electric vehicles are not the complete answer, what needs to be done? Here early action to promote a range of alternatives will pay dividends. As one report on urban form and carbon prices identifies (note 3):

This paper investigates the impact of path dependencies on the ability to reduce urban commuting CO2 emissions with a carbon or gasoline tax. Due to imperfect decision-making and long planning and construction timescales of new infrastructure, investments in public transport are not always optimal, especially after changes in relative prices (e.g., due to carbon pricing). As a consequence, the provision of public transport does not adapt automatically and instantly to new socio-economic conditions. 

Our results show that public transport choices have a strong influence on the price elasticity of energy consumption and carbon emissions from urban individual transport. 

If the carbon tax is implemented to change behaviors and reduce GHG emissions, it makes economic sense to complement it with policies that increase the price elasticity of carbon emissions, such as technology and innovation support or the type of infrastructure investments discussed in this paper.

In other words, anticipatory actions for urban infrastructure changes need to be taken early, rather than be reactive actions.  Even Vector has noted that without sufficient planning and co-ordination, all consumers will face the risk of increased electricity costs and increased outages, if there is a sudden upsurge in use of EVs and associated charging at home.

Should EVs not be the complete answer, then public transport, walking and cycling will need to be more widely used. This will require different infrastructure that will take time to put in place. Public transport coverage is still ‘skeletal’ in many parts of Auckland, and will remain so due to the dispersed patterns of land uses; increased frequency and coverage of services will need public support. Meanwhile, other parts of the city are reaching the limit as to the number of buses that can
be accommodated, and dedicated infrastructure with greater capacity (like rail, LRT, BRT) is needed.

The same strategy of anticipatory actions needs to be applied to housing and associated land use patterns. Substantial work is needed to make urban areas ‘ready’ for changes in locational and density patterns. Evidence suggests that if transport and energy costs rise, it is usual for cities to consolidate, as outlined above. Households will seek to shift closer to workplaces and amenities to reduce transport costs, provided house costs are not exorbitant. It is possible that as demands on urban land rise, many businesses may shift the other way, looking for cheaper land and less busy main transport networks to locate near. Add in factors like a shift to mid-level timber office buildings in central areas (and away from taller concrete and steel towers) and retreat from areas affected by climate change (flood plains and areas subject to coastal hazards), then considerable adjustments to urban areas are likely.

It is possible that some forms of distributed energy systems will be developed that support more dispersed land use patterns, but the operating costs of such systems spread across a low population base are unknown. In the face of rising costs, consolidation is more likely than dispersal.
In turn, these adjustments need preparatory work to ensure that transitions are smooth, not overly costly for households that have to shift, don’t involve sudden shifts that raise the ire of existing residents and where infrastructure can be upgraded to cope with an influx of people. This extends to necessary social infrastructure like open space, schools and community facilities.

In particular, existing communities will raise questions about growth and change in their area as urban areas adjust to different cost pressures. This is inevitable and unavoidable. Communities cannot be ‘cut out’ of changes to zoning and development envelopes, but they can be mollified to an extent if they see that concrete actions are taken, in advance, to address issues like extra demands on infrastructure (social and physical infrastructure) and the provision of more green space. 

In short, planning ahead of changed demand patterns is needed. This planning has to anticipate and shape future urban land use responses to changing carbon prices, it can’t wait until the price pressures of urban change are felt and then react, as by that time it will be too late to act.

Notes

Note 1The Greenness of Cities: Carbon Dioxide Emissions and Urban Development
By Edward L. Glaeser Harvard University and NBER  and Matthew E. Kahn UCLA and NBER. WP-2008-07

Note 2: http://www.mfe.govt.nz/sites/default/files/media/Climate%20Change/nz-ets-review-discussion-document-november-2015.pdf

Note 3: Carbon Price Efficiency Lock-in and Path Dependence in Urban Forms and Transport Infrastructure. The World Bank Urban Disaster and Risk Management Department Urban

Monday, 21 May 2018

Productivity Commission report: low emissions economy


A few quick reflections on the Productivity Commission's draft report  on a low emission economy. (Note 1)

First up, why does the report  say ‘economy’, not ‘society’ or ‘country’? Sounds like we just need to make a few economic adjustments (for example, better price carbon), otherwise we can carry on as normal. Perhaps that reflects the basis of the report - apparently the Government asked the Commission to identify options for how New Zealand can reduce its domestic greenhouse gas emissions through a transition to a low-emissions economy, while at the same time continuing to grow income and wellbeing.

But of course the report does not say that only a few adjustments are needed. Rather, there are big changes needed that will affect incomes, wellbeing and communities.  Feels a bit like a mountain to climb. Four big actions are noted:
  1. getting emissions pricing right, to send the right signals for investment;
  2. harnessing the full potential of innovation and supporting investment in low-emissions activities and technologies;
  3. creating laws and institutions that endure over time and act as a commitment device for future governments; and
  4. ensuring other supportive regulations and policies are in place (including to encourage an inclusive transition).
Do any of these big changes relate to urban planning?

Changes to urban form to encourage lower emissions are given short shift by the Commission. Not surprising given previous reports from the Commission on  miss-behaving planners and urban designers. The low emissions report says: “Overall, evidence reveals modest emissions reductions associated with a transition to more compact urban forms, provided that this occurs in tandem with changes such as improvements in accessibility and public transport. However, rigidly enforced, urban planning policies that seek to contain growth can be detrimental to housing affordability and run counter to the housing and location preferences of most New Zealanders. In addition, achieving increases in the type of density that reduces vehicle travel is not straightforward. The process is gradual, so any material benefits are likely to take decades to eventuate”.

There is also the normal rider that cities are all too complex to manage other than by way of efficient markets, but let’s not worry about that comment.

I tend to agree with the Productivity Commission that urban form changes can be slow, and by themselves may not amount to much in terms of lower emissions.

But on the other side of the coin, correctly pricing carbon suggests big, and potentially rapid (disruptive even)  changes for households and businesses. The report rather shyly notes:

The mitigation policies recommended in this report could increase the costs of household energy, food and transport.

Change transport costs and urban form changes. Increase other costs and money available for housing shrinks, all else being equal. If transport costs go up, and money available for housing goes down, then expect households to want smaller sections and houses closer to public transport. Sounds like compact city.

Of course, we all might switch to electric vehicles, so higher petrol costs don’t matter; while less restrictive planning schemes will reduce land costs for housing, so some higher energy and food costs don't matter either.

What about electric vehicles? Elsewhere, others have noted that the domestic electricity grid that serves most homes is not set up to have all houses in a street recharging their vehicles overnight.  For example, this is from Vector (see Note 2):

"the amount of power required to charge an EV with a long-distance battery, at home in the suburbs, would put a strain on existing infrastructure. The perception that networks can absorb the uptake of EV charging is only true for the short term while batteries have a short-range capability, customers are satisfied with long charging times and chargers are evenly distributed across the network".

An electric bus fleet may be more likely. But a bus network that meets 50% or 60% of trip demands is a lot different from the network that we have today.  There will have to be a degree of clustering of homes and businesses into a multi nodal city for a network to work - less of the current dispersed pattern of home and work places , but not as concentrated as some might contend.

But wait, there is more. The Commission’s report notes that: “Transport has been the biggest contributor to New Zealand’s rising emissions over the last thirty years. Yet, the wide range of mitigation options already available for transport means it can play a greater role than other emitting sources in achieving a low-emissions economy”.

“More broadly, investment skewed towards roading and a failure to price negative externalities from private vehicle use has led to high private vehicle travel and inefficient vehicle choices. More cost-reflective pricing of vehicle externalities would lead to more efficient and lower emission outcomes. Finally, with a level playing field for investment in infrastructure, the transport system would better support rather than stifle shifts towards low-emission modes”.

So travel by private vehicle may be priced more highly for other reasons and less and less new road space built for cars. It is a double whammy - higher prices and less road space. This is quite a fundamental shift.  This may be especially so for our mid sized cities - places like Dunedin, Tauranga and Hamilton, even Napier and Hastings, places without the critical mass to support good quality, frequent public transport.

What about building design and things like heating? Any pressure there to change urban form? Here I also have to agree with the Commission that building design may have less of an influence on green house gas emission than other measures. For example, there is some evidence that taller buildings consume more energy than low rise buildings (think lifts and pumps and lighting and heating of common areas like hallways and lobbies in apartments), while the larger roof area of stand alone dwellings versus people accommodated mean there is more scope for energy needs to be met by solar power, for example. Steel and concrete are ( I think) more carbon intensive building products than wood.

So a bit of a tension here between different transport modes and urban forms.   Perhaps there is a meeting in the middle - 3 or 4 storey wooden apartment buildings built to conserve and generate energy, structured around a bus-based transport network. Space will also need to be found to grow food and manage wastes in less energy intensive ways. So also big changes in open space networks?

In short, urban form will respond to a high carbon price / low GHG emission society and to be fair the Commission aren’t against the planning system accommodating these ‘consumer-driven’ changes.

To me, what is more at issue is the potential contradiction with other outcomes identified by the Commission for urban planning and affordable housing; actions like more greenfields land for housing and reducing the costs of housing by freeing up urban land markets, even if that means paving over some good vege growing land. If these ‘cost reducing’ actions are taken at the same time as the measures to fully price carbon, then good. But if they are not, and the carbon price bit comes later, then there is the real prospect of a ‘shot in the arm’ for poor urban form (low density car dependent subdivisions) just before the costs of this approach start to skyrocket. This is a recipe for a major government liability.

Moreover,  it is interesting that in other areas of the economy, the Commission notes the need for countervailing policies and actions (actions to slow the high carbon ship and to lessen the costs of transition to a low carbon waka). For example: 

“The transition to a low-emissions economy will require policies that lean against path dependencies that can lock-in polluting technologies and patterns of production. These dependencies arise from market size, scale economies, the cumulative nature of knowledge, network effects, sunk investments and political pressures from vested interests.”

To my mind most urban development falls into the path dependent categories listed (market scale, sunk investments, vested interests). So in one area of the economy there is a need to help with a transition (a plan even!),  but in another it can be left to the market. This is not to say that compact urban development should be ‘forced’, as there is a difference between help and compunction, but you would have thought that the Commission could have come up with a bit more of a considered response as to how urban areas will need to transition and the different tools and techniques needed.

I get the feeling that they got trapped by their previous reports.

Note 1: https://www.productivity.govt.nz/sites/default/files/Productivity%20Commission_Low-emissions%20economy_Draft%20report_FINAL%20WEB%20VERSION.pdf

Note 2: https://www.stuff.co.nz/business/102240245/power-network-may-struggle-to-deal-with-electric-vehicles

Friday, 4 May 2018

Houses, flats and apartments (5) - the muddle in the middle

More on the 'middle' - medium density housing in the middle ring of suburbs and the return of the sausage.

I don't think Auckland has a missing middle to its density profile; I think the issue is more of a muddle as to how to manage the steady upwards shift in density in the middle.  We need to look 10 to 20 years ahead and work out how to accommodate more density across large swaths of the city, as we finish off one super cycle of  economic activity and start to enter another cycle.
The old way of managing infill and site-by-site redevelopment may have run its course. Hopes of some sort of publicly-initiated, grand redevelopment of whole suburbs that can replace the old methods of incremental infill will never get traction. So site-by-site redevelopment will continue to occur. Will the sausage block return or is there a new middle way for the middle?

It is interesting to look back at the analysis done for the Proposed Auckland Unitary Plan as to possible development typologies in  the Mixed Housing zones. Was the plan alive to the issue of the modern day sausage block?

A number of different lots sizes and layouts were modelled. I want to look at the larger lot size, which is more conducive to a modern day sausage block.

Below are some  images from work Council presented to the Independent Hearings Panel. The 1,000 sqm hypothetical lot is a bit of an odd shape, but never mind.


The building itself can't be more than about 6m wide, given the driveway and turning area is about 7m wide and the open space areas 4m deep, leaving 6m out of the 17m lot width to build on. A 6m wide building seems a bit narrow, but never mind.  What is interesting in the concept, three blocks of two units, with gaps in between. Driveway down one side and outdoor living areas the other side.


And here is the three storey version, which is just the two storey model lifted up one floor.


The idea of the breaks between the groups of buildings was probably trying to address the possibility of sausage blocks.  The proposed Unitary Plan described these breaks as managing the length of buildings to visually integrate then into the surrounding neighbourhood.

That idea did not pass the scrutiny of the IHP Panel.

The funny little cut outs on the ground floor provide for the required 6m outlook area from the main living area. More than likely,  outlook areas will be positioned so that they extend over the driveway (being a space about 6m wide in most cases), allowing the building to spread out more on one side.

What is more, the modelled building only occupies 27% of the site area, not the 40% possible under the proposed rules.  Also interesting are the notes to the left of the diagram (sorry, the above scan is hard to read). These notes say that there are design criteria that will ensure that the building addresses the street and that the building's form will be modulated. Some hope.

So what was presented was a slender, broken up sausage, which doesn't look like a very realistic prospect.

Taking a step back, perimeter block layout is kind of the preferred layout of medium density development -  keep the buildings hugging the street edge of the block, forming a  built perimeter; keep the interior of the perimeter as green, private space.  Even the Auckland Design Manual refers to this as a preferred form:

All buildings should have a public front and a private back. It is better to align buildings with public streets or open space and create a defined street edge, and to maximise back to back distances with other buildings. This pattern of development allows for ‘perimeter blocks’ which reinforce the street edge and maximise the available open space within the centre of the block.


But is this urban form suitable for Auckland's hills and its steep sided valleys and ridge lines? Perhaps on the flatter areas?  

The Proposed Unitary Plan took  a number of steps to promote more of a perimeter block layout.

An alternative height in relation to boundary control was introduced as an option which allowed more bulk at the front of the site. The diagram below shows the extra building form possible at the front although not all of this is exploited in the model.
But application of the alternative standard requires resource consent. Furthermore, there is no obvious link with keeping back yards clear of buildings (more bulk at the front, keep the green space at the back), you just end up with more bulk at the front and lots at the back. The alternative height in relation to boundary control now kind of languishes in a 'no mans' land.

The proposed plan also used minimum density controls. Those controls were manipulated to allow more dense development on sites with greater road frontage. Again this was designed to promote buildings fronting streets, rather than be 'side on'. But the density control got removed in the rush to provide capacity.

The requirement for an outlook area from the main living area could also be used to orientate buildings so that they either face the street or a generous back yard. A 6m deep outlook area is required, but that dimension means that more often than not, the 6m can be squeezed into a standard suburban site, as part of a side yard or over a driveway. 10m would be better, but calling it an 'outlook area' tends to imply it is about on-site amenity - if people want a compromised outlook, then that is their matter. Meanwhile rear yards can be as small as 1m.

So some half hearted proposals to address 'side on' development blocks were introduced, but some didn't last the distance, with others are only half baked. Hence, a bit of a muddle?