Friday, 16 October 2020

Has the housing deficit gone?

The RMA is again being blamed for soaring house prices. There is a ‘shortage’ of houses, with this shortage caused by restrictive zonings and district plans that are slow and cumbersome to change. But is it all a bit of a supply myth? 

For example ASB bank’s recent flyer on housing says that a “second factor we believe is behind the housing resurgence, a more severe housing shortage. It now looks as if the shortage that developed over the past five years was larger than most appreciated. We’ve updated our estimates of such to reflect Stats NZ’s recently upgraded population estimates. The upshot is that NZ’s long running residential construction under-build has produced a shortage of around 60-65k houses, around twice what was previously assumed”.

But as I have pointed out a number of times (as have others), a lot depends on how you calculate the shortage, and what you assume to be a reasonable response between demand (population growth) and supply (a dwelling being built). 

Previously I have looked at issues like:

  • Possible over estimaiton of migration flows and population growth
  • The composition of demand, and the extent to which recent population growth has been driven by migration and uncertainty around the intentions of younger people on worker visas
  • The lag between population growth occurring and houses being built. Evidence is that there is at least a two to three year gap between a building permit being issued and a completion certificate being signed off.

Time to have another go. 

Statistics NZ have updated their yearly estimates of population growth in the light of the 2018 census. So I thought it would be good to re-run the numbers on demand and supply. I have done this for the two ‘hot’ property markets of Auckland and Queenstown.  

Stats NZ provide an annual estimate of resident population for all Council areas. The most recent set for 2020 says that the estimated resident population (ERP) of each area is based on the 2018 Census usually resident population count, with updates for:

  • residents missed or counted more than once by the census (net census undercount)
  • residents temporarily overseas on census night
  • reconciliation with demographic estimates for ages 0-14 years
  • births, deaths, and net migration between census night and the date of the estimate.

The estimated resident population is not directly comparable with the census usually resident population count because of these adjustments.

Stats NZ have completed an intercensal revision for estimates between June 2013 and June 2018, to reconcile with the estimated resident population 2018-base. This has seen some downward revision of previous estimates.

Based on these recent estimates I have attempted to estimate housing demand and supply over the period 1997 to 2020. A long time period is needed, as plannnig is a long term process.  

As previously noted,  a range of assumptions need to be made. 

First up, demand for housing is based on annual population growth divided by the average number of people per occupied dwelling. The average number of people per occupied dwelling can be calculated at the time of each census, as follows: 

Table 1: Auckland and Queenstown dwellings and resident population


2006

2013

2018

AK - occupied dwellings

438,609

472,044

498,789

QLDC - occupied dwellings

9,090

11,190

13,719

AK - resident pop

1,373,000

1,493,200

1,654,800

QLDC resident pop 

24,100

29,700

42,500

This data gives me the following average number of people per occupied dwelling.

Table 2: Auckland and QLDC people per occupiued dwelling 

Year

2006

2013

2018

Auckland

      3.13

    3.16

  3.32

QLDC

       2.65

    2.65

  3.10

Some people at this point suggest that the rise in the average number of people per dwelling is not an independent variable. It is a sign of rising unaffordability as people share living spaces due to high housing costs, when the trend should be for fewer people per dwelling (more choice and more space). Others have pointed out that in Auckland at least, other changes like a younger population and possibly more multi-generational households formed by migrants helps explain the increase. 

For example, for Auckland, there has been a dramatic change in the composition of growth, and with it likely demand for housing between the 2000s and 2010s.  The graph below shows the change in the number of residents by age band, from 1996 to 2018. Through the mid 1990s to mid 2010s, the dominant group were the high income earning 40 to 64 year olds, many of whom would be looking for a ‘new home’. From mid 2010s, the largest group by far are the younger 15 to 39 year olds, many of who may be living at home or in flatting type situations, or after a second (or more) hand home. 

Figure 1: Demogrpahic change - Auckland Region 

This change in demographics must change housing markets, reducing demand for new homes to buy, slowing the flow of homes into the stock of housing, while at the same timing raising the demand for existing houses. 

To determine demand, I have used the above data from the census on people per dwelling. Spreading out these rates on an annual basis leads to an estimate of demand for dwellings. 

Supply is based on building permits issued. Building permits issued does not necessarily accord with the number of dwellings that are consented by way of RMA processes. There is no reliable way of counting how many ‘RMA consents” for new dwellings are issued each year. It could be that dwellings enabled by the planning system in each year is way ahead of building consents issued. 

For this exercise, I need to run off building consents. Supply of new houses is based on the number of building consents issued in the two years after the estimated demand. That is, I have assumed that there is a lag between population growth occurring and house plans being drawn up, building permits obtained and houses built. In other words, the number of houses built in any year will likely reflect what demand was at least two years prior. So matching annual population growth with building permits issued in that same year is miss-leading. 

However, some building permits for new dwellings will involve the removal or demolition of an existing dwelling. Comparing the increase in the number of dwellings (occupied and unoccupied) counted by the census with the number of permits issued in the preceding period (but lagged by you years to account for time to complete a building) gives me a guide as to how many permits are for replacement dwellings. My estimate is that in Auckland, 94% of permits are for new dwellings (not replacements). 

Table 3: New dwellings versus building consents for dwelling units

Auckland 


New Dwellings

2001-2006

2006-13

2013-18

2006-18

52,087

33,465

32,778

118,330


Permits

1999-2004

2004-11

2012-17

2005-17

47,710

50,323

27,398

125,431

New dwellings as %

of permits issued

109%

67%

120%

94%

The data suggests some unders and overs. For example between 2006 and 2013, 33,465 dwellings were added to the housing stock in Auckland, yet in the period 2004 to 2011, over 50,000 building consents were issued. A large number of consents must not have been actioned, or they took much longer to complete than 2 years. 

In my analysis I have used the average for the period 2001 to 2018. 

In Queenstown, the net addition rate is closer to 97%.

Table 4: New dwellings and building consents for dwelling units - QLDC


New Dwellings

2006-13

2013-18

2006-18

2,727

3,483

6,210


Permits

2004-11

2012-17

2004-17

4,157

2,237

6,394

Permits as % of new dwellings

66%

156%

97%

Next allowance needs to be made for ‘unoccupied’ dwellings - second houses, holiday homes and the like. In Auckland, census data suggests that of the total housing stock added between 2006 and 2018, 10% were unoccupied dwellings. In QLD it is more like 25%. Unoccupied means clearly not occupied on the night of the census. 

Table 5: Occpied dwellings - Auckland and Queenstown 


2006-13

2013-18

2006-18

AK

Total new dwellings 

33,465

32,778

66,243

Occupied

33,435

26,745

60,180

% Occupied

99.9%

81.6%

90.8%

QLDC

Total new dwellings

2,727

3,483

6,210

Occupied

2,100

2,529

4,629

% Occupied

77.0%

72.6%

74.5%

To put it together, for example in 2016 to 2017, the population of Auckland City grew by 35,300. At a ratio of 3.29 people per household, this equals a demand for 10,740 new dwellings. In 2019, building permits for  13,754 dwelling units were issued. Assuming that 6% involved replacement of an existing dwelling, then 12,929 new dwellings were added to the stock (net growth). Of these 91% were for occupied dwellings, or 11,745 dwellings. This then equals a surplus of 1,005 dwellings. .

Below is the graph of the annual demand and supply from 1997 to 2018, for the Auckland Region. There is a ‘deficit’ over this period of 14,000 dwellings.  The last 10 years (1999 to 2018) has seen a deficit of 3000.This is a lot less than the 30, 000 to 40,000 sometimes bandied about. 

Figure 2: Auckland region: estimated housing demand and supply

The recent upward swing in building permits for new occupied dwellings suggests that the housing market is responding (as has the RMA). The deficit really built up in the post GFC period, and then it did take a while for the new build market to respond to the fast population growth between 2013 and 2018. 

The accumulated surplus/deficit looks quite large, when graphed. See below. Since 2017, substantial inroads have been made.  
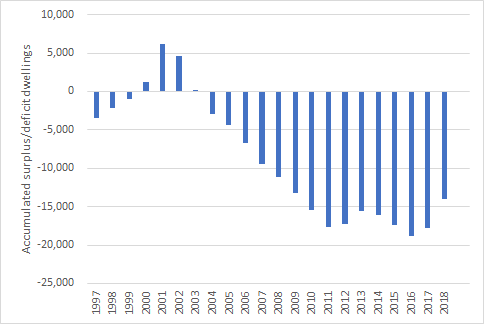
Figure 3: Auckland Region housing surplus/deficit


The same exercise can be  undertaken for Queenstown Lakes District. Here there is a closer match between demand and supply, with some divergence over the period. Is this divergence enough to explain the large increases in house prices seen over this period?  
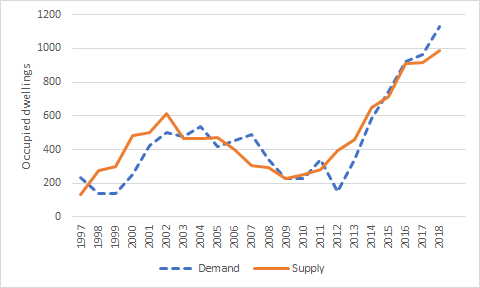
Figure 4: Queenstown Lakes District demand and supply estimate


There is an accumulated surplus of 480 dwellings, using the methodology set out above. 
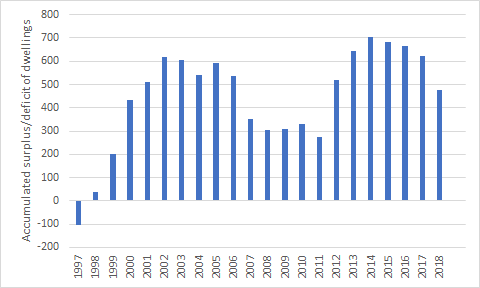
 

Figure 5: QLDC housing surplus

Is there a supply myth? And if it is all a bit of a myth, what is the implications for the reform of the RMA and implementation of instruments like the National Policy Statement on Urban Development? 

Planning needs to keep adding new capacity for more dwellings and businesses, but adding more capacity will not necessarily bring forward more affordable houses for households on low to moderate incomes.  Urban quality is also important, and shouldn't be left behind in the dash for more capacity. 


Thursday, 27 August 2020

RMA reforms: In search of a purpose for urban planning


The report of the RMA reform panel  “New directions for resource management in New Zealand” is out. First a note of caution. Previous RMA reform proposals have involved many reports on many topics. Often what gets picked up is some of the easy stuff. This time around, we are told that it will be a comprehensive review. 

A Natural and Built Environment Act is proposed, along with a Spatial Planning Act and a Managed Retreat and Climate Change Adaptation Act. No mention of the fate of current ‘add ons’ like the Waitakere Ranges Heritage Protection Act, Special Housing Areas, or Covid fast track. And what about the Urban Development Act that enables Urban Development Authorities to bypass the RMA (or its replacement) by establishing their own streamlined planning and consenting process? Not too sure how this all adds up to an integrated approach; the trick is going to be which plan gets developed first. 

My pick would be the any plan under the Managed Retreat and Climate Change  Act should be sorted out first, then any special area plans (like Waitakere Ranges and plans prepared by UDAs) be drawn up, along with identification of ‘limits’ under the Natural and Built Environment Act. Spatial plans can then be developed and agreed within this context, with relevant remaining details then filled out in the combined plans under the Natural and Built Environment Act.

Sounds exhausting, but then the alternative could be a whole bunch of plans being prepared at the same time, all bumping up against each other. 

Looking at the review report, I think the Panel have had too big a job in too little time. I would have thought, given the size of the project, it would have been broken down into a range of sub tasks and working groups to tease out issues and options before some sort of combination process. To me there is a lack of depth as to urban planning issues, and I think that has arisen from the scale of the project. The report feels like it has found its feet over management of natural resources, with talk of limits, improvements, better methods of allocation and a focus on outcomes. These concepts look like they have been rolled over into the urban sphere without much thought. 

In search of a purpose for urban planning.

The main issue I have is that there is a lack of a firm foundation for urban planning. The reform proposals repeat the common concerns over urban plans being unresponsive to demands, too slow to change and adapt, adding too much cost and delay, captured by special interest groups and NIMBYS. 

But this is a reactive approach. It does fit nicely into a bigger narrative: ‘ease up on urban areas, tighten up on the natural environment’. But it is not a forward looking approach. 

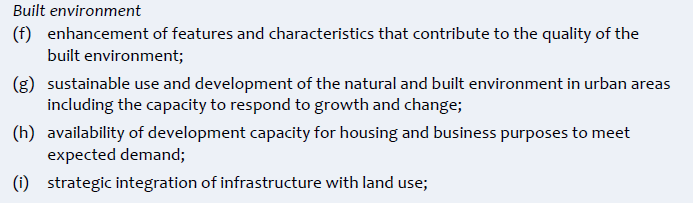
The following purpose for the new Act is proposed:

Any definition of quality? Or what is an 'enhancement' (positive for me, but negative for you)? These are broad concepts that need to be operationalised.  The following doesnt go very far.

A different set of plan making principles apply to urban areas to those for the natural environment (although it is not clear how they are reconciled when so much of our urban environments are intertwined with natural environments - coastal area, streams, maunga, bush filled gullies). Nevertheless, this is a good start - to recognise the differences between managing finite stocks of natural resources versus the ebb and flows of physical resources found in cities.  

The urban planning principles are: 

No reference to amenity. This is deliberate, as maintaining amenity is used as the cloak for ‘don’t touch my neighbourhood’. But yet what is the replacement? The even less-defined and more emotive term: ‘quality’. 

Apart from being ill defined, improving the quality of the urban environment is not really a sound basis upon which to manage urban resources.  Everyone agrees with better quality, so it is understandable that this ‘outcome’ is reached for when trying to find a place to stand. But public policy requires some sort of ‘failure’ or ‘problem’ to be identified upon which action to curtail or shape private actions can be justified, and poor quality development has never featured strongly as a reason to intervene in urban environments.  

But neither is saying that planning has got caught up in a big cobweb of NIMBYs a sound basis upon which to build a new approach.

The Review group acknowledge that urban planning is a complex mediation between public and private interests, over space and over time. But they are worried about plans getting caught up in the detail:

Our view is that to achieve good environmental outcomes and make the greatest contribution to the overall wellbeing of communities, urban planning should be more focused on setting the high-level patterns of land use for urban development and less focused on developing the elaborate and overly complex regulatory controls that are characteristic of current district plans. In the words of Jane Jacobs, urban planning is a science of “organised complexity.

The best response to this complexity is to combine strategic direction with simple rules. The ‘outcomes’ set to guide urban planning should therefore recognise the dynamic nature of urban areas, ensure development capacity is available for growth and change, and ensure that the way in which overall urban form contributes to wellbeing is broadly understood. 

Somehow this feels like a bit of a cop out. Where have we heard the call for a ‘few simple rules’ before? A few simple rules usually come accompanied by a large does of discretion to administer them. Reduction of that discretion requires more detailed, place-based rules. 

Of course Jane Jacobs' recipe for urban success actually relies upon attention to details; details like windows overlooking streets, short city blocks to generate movement, access to a range of old and new premises to enable mixed uses. We can add a visually stimulating and safe urban environment to that list. These are not qualities that are easily ascribed in a high-level plan and a few simple rules. 

Jane Jacobs was writing at the time of large scale, state-led urban redevelopment that saw block-busting, ‘towers-in-space’ replace older row houses and walk up apartments; and a jumble of  local shops and live work units. No wonder she referred to the complexity of urban environments that were being destroyed by a ‘few simple rules’. But it was more than just a call for an understanding that urban environments are complex; this complexity needed nurturing. Complexity did not necessarily spring forth naturally, nor did it continue to replicate by itself.  

Things have moved on from the 50s and 60s. The fourth industrial revolution is taking hold, kicked along by covid 19. Work and home are blurring, the neighbourhood is taking on a more central role in city structure than the old dichotomy of the centre and suburb. Work and incomes are becoming more precarious. 

What about the following as rationales for intervention in this emerging urban environment:

Managing the accumulation of many small positive and negative changes

Fixing up other messes

Tackling concentration and inequity 

Greening the city 

Helping make trade offs

Future effects - taking a long term view.

What do I mean?

Accumulation of many small positive  effects.

Cities change incrementally, site by site. While we may get caught up in the excitement of spatial planning for a region, cities morph and change constantly with or without spatial planning. Much of urban planning has to involve micro management of this change.   A few simple rules will not cut it. If cities die by a 1000 cuts, then they flourish by a 1000 small acts of kindness.   Perhaps reference to positive enhancements is helpful here, but the Act needs to tackle how to anticipate and manage many small, cumulative changes.

Fixing up other messes

Much of that larger scale urban change is driven by distorted signals sent out by other activities: poorly priced transport systems generate sprawl and ruin neighbourhoods with traffic; obesogenic environments filled with too much sugar and junk food and not enough options for walking and cycling see streets and lots filled with car-orientated developments; financial systems poorly tuned drive up house prices, creating huge incentives for landowners to protect their patch, and a retreat from building of affordable homes.  Planning has to be a counterbalance to these forces. It may be a second best counter balance compared to tackling the underlying causes, but at least urban planning is trying to help reduce these adverse pressures and signals in what should be an integrated way. 

Tackling concentration and inequity 

As the economy becomes more unequal, productivity falls and markets become dominated by a few big players, so do cities. Options for people to climb the economic ladder reduce. The middle classes are stuck. There is a need for urban environments to be more democratic and to actively support choice and opportunities.  If planning in the 20th century was about exclusion and  separation of uses, is planning in the 21st century about the active inclusion of a greater mix of uses and activities in all neighbourhoods?  

Greening the city

This is more than just protecting the remnant natural environments left in cities. This is about mental health. It is about cities environments being restorative. As work conditions become more ‘flexible’ and less certain, populations become more diverse culturally and in age range, the city environment becomes the balm which helps to smooth nerves and promote community interaction. We have seen a glimpse of what is possible in the first covid 19 lock down. Having accessible green ‘elements’ close by, in all neighbourhood becomes ever more important.   


Helping make trade offs

Planning is about making purposeful trade offs for the above types of community benefits where necessary; rather than leaving trade offs to be made by market processes. This is a public process, it also one that needs a high degree of discipline and guidance, otherwise decision making is open to many imperfections. As our understanding of environments improve and the digital revolution takes hold, the old claim that markets make faster and better decisions than people sitting around a table becomes less relevant. Sure, public decision making needs to be confined to where it matters, but that is not the only role of a planning act. It must also spell out how to make trade offs within those confines. Section 6 of the RMA may not have been perfect, but by stating somethings are more important than others, decision making was improved. It is hard to see in the reform proposals anything which clearly says: ‘in an urban environment, these values are more important than those.’ 

Taking a long term view

This is also about how decisions are made. So many pressures support the status quo, taking a short term view of change. Planning has to be forced to take a long term view, otherwise planning can end up being used to shore up the short term. 

Back to the issue of what is urban quality. 

Interestingly, the discussion document that described the draft  NPS-UD referred to a list of urban qualities, as follows: 

The preamble to the NPS-UD would contain a wider description of things that contribute to

quality environments. This could include:

• reducing the impact on the natural environment

• using ecologically sensitive design

• enhancing safety and good health

• promoting resilience to the impacts of natural hazards

• providing a range of transport options

• reflecting historical and cultural heritage in the urban environment.

Not a bad list. But none of this has been picked up in the NPS-UD nor the proposals for the new Act.Why?

Tuesday, 18 August 2020

Some more thoughts on working from home

Working from home (WFH) is apparently the new big trend accelerated by the Covid 19 pandemic. To some, WFH will spell the end of the central city office tower (and associated inner city cafes); spur a new round of sub regional centres filled with flexible workplace hubs and see further expansion of the urban footprint as workers freed from the daily commute, search out larger houses and sections on the urban fringe. 

Next question: given all that, do we need the Central Rail Link anymore? 

But who actually works from home? As people have noted, you need to sit as a desk with a computer to be able to work from home. But maybe not, perhaps you are an artist who uses paints or an author who still uses a typewriter. Then there are folk like farmers who mostly work at home. 

We don't have a great deal of information about who works from home and if that is a full time or just part time arrangement. Stats NZ suggest, based on a survey in 2018, that ‘more than one-third’ of employees have worked from home in their main job. Turns out the ‘more than a third' means between 33 and 35% of those who responded to a survey. There was variation by occupation. It was most common for professionals (58 percent) to have done some work from home, followed closely by managers (57 percent). The occupations where it was least likely to have done some work from home were machinery operators and drivers (6.0 percent), followed closely by labourers (6.5 percent). You do wonder what labouring on a building site you can do from home!  

For a bit more detail, the 2018 census asked people if they worked from home. This was in response to the question of what people’s main means of travel to work was. Main means of travel to work is the usual method by which an employed person aged 15 years and over used to travel the longest distance to their place of employment (for example, by bicycle, public bus, walking, or driving). 'Usual' is the type of transport used most often - for example, the one used for the greatest number of days each week, month, or year. If there are two (or more) forms of transport used equally as often, the most recent form of transport was recorded. So if someone ticked ‘worked at home’, it is likely that this was a full time arrangement, rather than a one day a week type situation. 

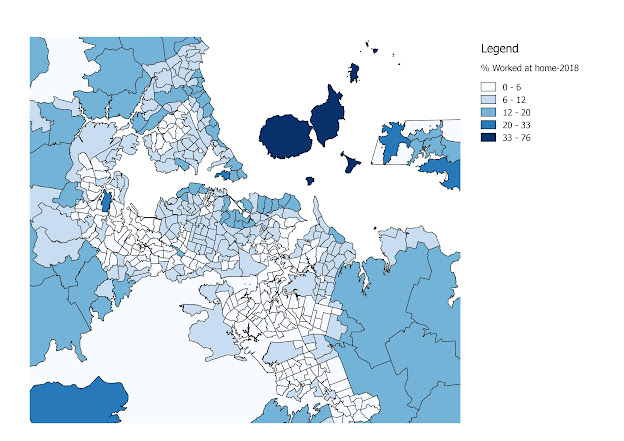
In the Auckland Region, 72, 000 people said that they usually worked at home, out of total responses of 825,000, or about 9% of the respondents. This rate is fairly consistent across the other two big urban regions (Wellington and Canterbury) with 9 and 12% of workers respectively. But who worked from home - what occupations were the most common WFH'ers, and where did people live? If you look at the map of who worked from home in 2018 in Auckland, then the ‘work from homers’ were concentrated along the eastern seaboard; that is the eastern central Isthmus and coastal north shore. The map shows the percentage of employed residents over 15 years old who worked at home, by census area unit. 
Figure 1: % working from home - 2018 census

Sure, there is a ring of work from homers in the rural areas surrounding the city, but these are probably mostly farmers and lifestylers. What is interesting is the low rate of work from home in the west and south of the urban area.

Unfortunately, the 2018 census does not list travel to work arrangements by industry. The 2013 and 2006 census do. Figure 2 below is the percentage of workers who answered the census question and ticked worked from home when asked for their means of travel to work on the day of the census. The two big groups of WFH'ers were rental, hiring and real estate jobs; and professional, scientific and technical services . In other words real estate agents and consultants. Arts and recreation were also above the average. 

 Figure 2: Percent of workers working from home by job category, 2006 and 2013


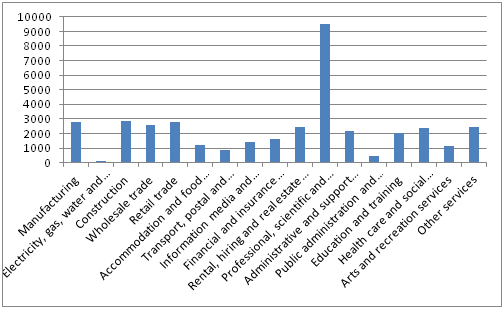
In terms of numbers, the professional, scientific and technical services stand out, and that makes sense; it is a big employment category in the Region and one where workers do spend a lot of time sitting at a desk with a computer, and many maybe self employed. 

Figure 3: Number working from home by job category, 2013

Now the pandemic may prompt more people, and a different set of workers, to work from home than that recorded by the 2018 census. But equally it may just reinforce current patterns. If so, will more work from homers see more sprawl and less congested roads? My pick is no to both. 

WFH may weaken demand to travel into the central Isthmus but it is unlikely to reduce demand for  travel from western and southern residences to workplaces in the southern Isthmus and Manukau. The potential outcome is weaker public transport demand into the CBD,  not less; while the cross-town car travel demand remains. 

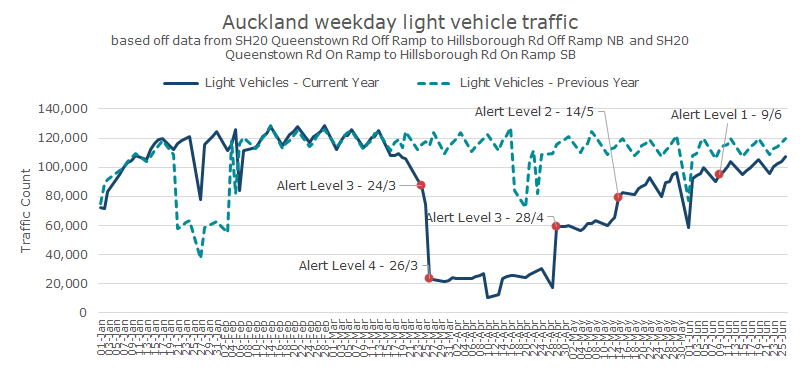
NZTA reports (pre the current Covid 19 Level 3 2.0) traffic on Auckland’s motorway network is now 89.7% of same time last year. The below graph is counts from SH 20, an important cross town link between the west and south. 


Figure 4: NZTA traffic counts - SH 20, Auckland

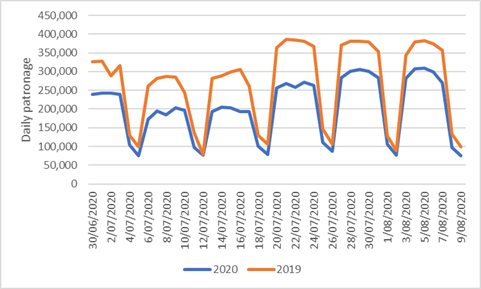
As for public transport patronage, data from Auckland Transport (see below) suggests patronage is at about 80% of the same time last year, for the month of July. The decline is strongest in the weekdays (the humps in the graph, the dips are the weekend). So maybe the work from homers is having more of an impact on public transport than car journeys. Kind of makes sense when you see who does work from home. 

Figure 5: Auckland Transport public transport patronage, July 2020 and July 2019

What about the move out to the edge of town for all those real estate agents and consultants freed from the daily commute ? This seems unlikely given the attraction of the living environment of the central Isthmus and coastal north shore to these groups of workers. Further more this group probably has some of the better and easier commutes than most other groups. If the lockdown is any case study, any time saved from not travelling into the office is likely to be spent enjoying the inner city environment. And yes demand for CBD cafes may go down, but demand for a coffee in the inner suburban centres is likely to go up.

Monday, 27 July 2020

The new NPS-UD

The new National Policy Statement on Urban Development (NPS-UD) is out.
Image result for 6 storey building - paris

A quick read through prompts a few thoughts.

What happened to quality intensification?

The policy actively supports (enables) intensification close to main centres and rapid transit routes, which is a big step from the previous statement which was kind of agnostic about whether urban areas should go up or out. But what happened to quality intensification? 

I can't find a mention of quality urban design. I guess plans can still address this. At least the NPS-UD doesn’t require bad design, but it would have been helpful to have a reference to quality urban design. 

Whereabouts?

Policy 3 ( c ) is the interesting policy. This requires that plans 'enable': 

building heights of least 6 storeys within at least a walkable catchment of the following: 
(i) existing and planned rapid transit stops 
(ii) the edge of city centre zones 
(iii) the edge of metropolitan centre zones.

The references to rapid transit are all a bit loose and no doubt we will  spend hours debating what a walkable catchment means (it would have been good if they specified a distance or a walking time);  what is 'planned' (how far in the future can we look) and what is a permanent route (road or rail) that is largely separated from other traffic (is a green painted bus lane that operates between 4 and 6pm sufficient?).

What does 'enable' mean:

Not much detail on what is meant by 'enable'. Enable a lot or not much? No mention of what activity status should be used (is a restricted discretionary status enabling? - depends on the extent of the discretion I guess). Does enable mean permitted or controlled? 

Subpart 6 – Intensification in tier 1 urban environments - says every tier 1 territorial authority must identify, by location, the building heights and densities required by Policy 3. 

Does the reference to building heights of at least 6 storeys imply some sort of minimum height? Is a two storey terrace house OK in the area to be identified for 6 storeys (or is that a waste of a scarce resource?). 

And when a consent is lodged, I'm  struggling to work out what the following means: 

Nothing in Policies 3 or 4 or this subpart precludes the consideration (under section 104 of the Act) of any actual or potential effects on the environment associated with building heights. 


Unresolved trade offs. 

The NPS's requirement to enable intensification close to city centres is likely to set up a big battle in inner suburbs between the 'intensifiers' and the 'retentionists' - those that wish to develop to 6 storeys or those who wish to retain special character areas. 

The policy allows for councils to opt out of the mandatory 6 storeys if one of a number of  'qualifiers' is present. These qualifiers include section 6 RMA matters (like heritage) but not section 7 matters like special character.  

There is a back door for special character to come into play - one of the policies allows for consideration of specific characteristic that makes the level of development directed by Policy 3 inappropriate in an area,  but the reduction has to be justified as to why that is inappropriate in light of the national significance of urban development and the objectives of this National Policy Statement; and include  site-specific analysis.  No mean task. 

The missing middle ring:

The shame of the policy is that it has stopped at the first 'ring' out from the centre, it didn’t go the next step and say what should happen in the 'middle' ring suburbs (apart from where a rapid transit line intersects these suburbs). Auckland has demonstrated the power of the removal of density controls in the middle ring. This is likely to be a much more powerful approach to intensification than what is proposed by the NPS (and more likely to be market driven).  So maybe the NPS could have simply said: 'ditch the density control and the minimum parking requirement".  But again, good urban design is vital. 


Infrastructure: who pays?

Policy 3.5 (availability of additional infrastructure) says that local authorities must be satisfied that the additional infrastructure to service the development capacity is likely to be available. 

It is not clear if that policy could be used to slow or stop the implementation of the intensification policy. If wastewater and stormwater systems are not up to scratch (like the western Isthmus in Auckland) or there is not enough open space in the areas where 6 storeys must be enabled, are these matters sufficient reason not to enable intensification? 

Who pays for the upgrades? Some new ratepayers in the area will help spread costs, but it will not be enough to cover all the costs. Should suburban residents subsidise the needed renovation and expansion of social and physical infrastructure required? This 6 storey development will not be in poor areas, they will be built for wealthy households (unless the units built are very small). 

Mixed messages over greenfields 

The cost / benefit analysis that accompanies the policy statement is actually quite helpful when it comes to greenfields, noting that benefits for housing affordability can be quickly lost due to a range of costs. 

This subtlety, however, seems to have got lost in the actual policy. 

There is reference to the benefits of out-of-sequence development. 

At the same time there is the need for certainty over infrastructure provision and while I may be reading things wrong, the implication seems to be Councils have to line up all the funding? 

What happens if the critical infrastructure is government delivered (eg motorway extensions or new rail lines?), or where the user should pay?  

What to do about climate change? 

The opportunity has been taken to add a bit in about climate change. 

Objective 8 says New Zealand’s urban environments should support reductions in greenhouse gas emissions; and be  resilient to the current and future effects of climate change.

Sounds good. The policy to implement this objective:

Policy 1: Planning decisions contribute to well-functioning urban environments, which are urban environments that, as a minimum:

support reductions in greenhouse gas emissions; and 

are resilient to the likely current and future effects of climate change.

So the objective and the policy are the same, which is not very helpful. This smacks of a quick add-on at the end of the process. This is a shame, given how important climate mitigation and adaptation are to urban areas. 


The importance (or not) of lots of capacity

As with the previous NPS, the focus of the statement is really on capacity for housing. It is not a holistic or integrated statement about urban development.

The focus on capacity is understandable, but perhaps it's hoped for benefits are over stated? 

Nowhere is there an acknowledgement of capacity already provided by plans. The NPS cost/benefit study, for example, seems to have a blank spot when it comes to the moves already made in Auckland to increase capacity. I guess the capacity is in the wrong spot. Capacity has always increased overtime. That’s the purpose of plan reviews and consents. Granted, past reviews haven’t been bold enough; perhaps the planners have been bold, but not the politics. 


The focus on capacity that is feasible and that is likely to be taken up tends to narrow long term urban development options, not open them up. Does the housing capacity to be provided in response to Policy 3 count as feasible and likely capacity (even through 6 stories is probably not feasible or likely in many places?). 


Sitting behind the NPS is a great deal of interest in the elasticity of supply of housing. House prices have gone up a lot (well land prices have), but housing production has apparently been sluggish. If only more houses were built, prices may stabilise. Why is supply more inelastic than in the past? There must be a constraint, goes the standard response. But is it that simple. Housing supply has become more inelastic over time. Is that because of boom and bust migration and economic patterns making 'over' supply more risky than in the past; the rise of housing as an asset meaning demand is set by the performace of other asset classes, not population growth; or is it the reduction in the number of traditional builders building a single speck house and the rise of various barriers to entry for new players into the housing development market, especially if more houses are going to be in 'groups' like terraces and apartments ? 

Finally, and I think importantly, there is a bit of a density paradox at play in most NZ cities. The wealthy like to live close to the centre, not further out. This is different from most American cities which tend to have low income inner cores and wealthy suburban outer rings. Inner city areas should be densely developed to provide cheap housing options. But wealthy households can consume quite a bit of land and floorspace, as well as benefit more than others from quicker commutes, so they look for good amenities, good proximity and substantial amounts of open space, and are happy to pay high prices for these attributes. In most NZ cities,  inner city suburbs are favoured spots for a range of households than can bid high for these properties, and once in, they don’t want too much to change. 

Our inner suburbs stopped developing at the two to three storey stage, they didnt revelop into the six storeys of Europe (which has a longer set of urban redevelopment waves). I don’t think an NPS is going to make that picture much different. Yes there will be some patches that can and should redevelop, but to make it all work, there is going to be quite a bit of shifting around of people and activities. What needs to be freed up first is the places that activities and households that get displaced (or which need to be displaced) can relocate to.  That is the real planning task.