Monday, 26 June 2017

More on house prices and planning


AUT’s Policy Observatory series has released a couple of interesting papers about housing markets and house prices.  Both have implications for the basis of the recently released National Policy Statement on Urban Development Capacity (NPS UDC). The NPS UDC was basically founded on the following statement:

“Existing RMA land use planning practices appear to respond poorly to the opportunities and challenges arising from urban development. In particular, planning policies can constrain development capacity and limit the ability of the market to meet demands in growing cities. This results in a limited supply of housing and rising property prices, as well as some localised problems meeting demands for business space.”

Notice the direct link drawn between rising house prices, limited housing supply and constrained development capacity. Rising house prices must be the result of constrained land supply which in turn is the result of planning. Planning will always constrain some capacity in some parts of the city for good reason and so the statement is true to an extent. Maintaining amenity and protecting the environment will also be reflected in higher house prices than might otherwise be the case. Whether capacity is constrained to a point that it unnecessarily puts pressure on house prices doesn't seem to have been tested. Neither does the effect of other influences on house prices.

But first a bit of context.

Annual net migration into NZ reached 72,000 in the year to May 2017 year, Stats NZ said on 22 June 2017. About 50% of migrants (people intending on staying in the country for more than a year) settle in Auckland, say 35,000 people. Add another 15,000 from natural increase and that is a population increase of 50,000 people. Divide by 3 and there is demand for 16,600 dwellings!

In the 12 months to May 2017, 10,200 dwelling units were issued building consents in the Auckland Region.

At the same time Quotable Value NZ reports that house values across the Auckland Region are continuing to plateau with values increasing by just 0.1% over the past three months.

So what is going on? Perhaps all that extra dwelling capacity enabled by the Auckland Unitary Plan has done the trick. While the number of building consents hasn’t really budged yet, maybe some of the steam in the land market has been released as more development opportunities come through from the rezonings? Hence house prices plateauing. Next we will see house building accelerate.

Of course there may be bigger forces at play.  

As I have previously commented on:

  1. The number of building consents issued is likely to lag population growth by at least 12 months.

  1. Demand for housing generated by the high net migration figure is not clear cut.  Between 1 January and 21 December 2016, 31,881 people were granted New Zealand citizenship, much less than the number of people counted as migrants. If we took  the 30,000 figure as the true demand for housing, then assuming about 15,000 new citizens live in Auckland plus the 15,000 natural increase, there is a demand for10,000 dwellings.

  1. The number of building consents issued closely follows the number of house sales - less house sales means less buyer confidence, so less building consents get prepared.

  1. Over the last 20 years or so land prices have risen substantially close to the core of Auckland, a reversal of the pattern post WWII when they fell, as transport accessibility profiles have changed.

  1. The planning process has always delivered development capacity, but maybe not always in the right location in terms of market demand, but then the role of planning is to manage that demand for long term benefit.

So there are a number of factors to say that the basic hypothesis of limited development opportunities means restricted housing supply which in turn means higher house prices  is not so straightforward.

The role of monetary conditions in this mix is not clear, but must be relevant. Finance (interest rates, availability of credit, excess capital looking for a return) has major implications for house prices, with asset inflation much more prevalent than general price inflation over the past decade.

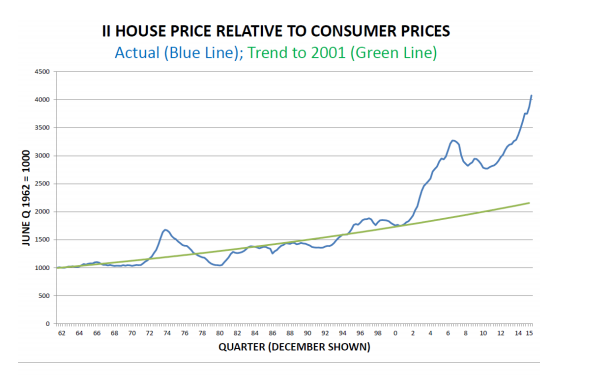
Brian Easton in his Policy Observatory paper has recently looked at the relationship between house prices and consumer prices in NZ, over the period from the 1960s to 2016. Below is a graph from his report for the AUT Policy Observatory website. He notes that house prices saw an abrupt increase around 2000. What explains this abrupt increase?


Below is a graph from the Economist website that I have cut and pasted as a screenshot. It tracks house prices relative to rents. In the website, you can click on any number of countries. I have highlighted Australia, Britain and Canada - our Commonwealth cousins.
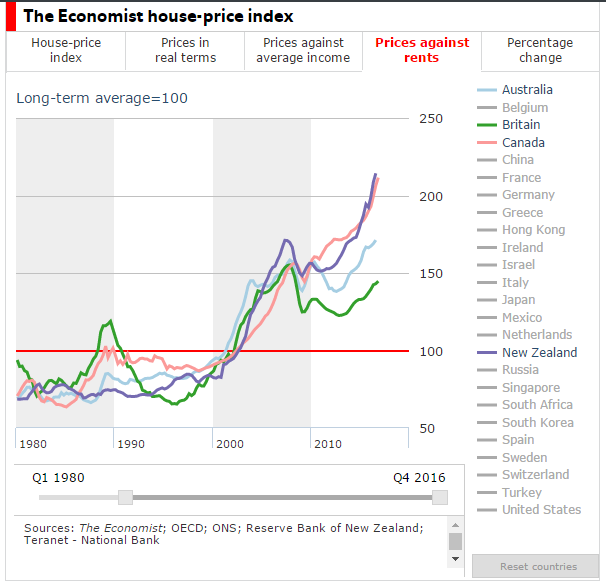


The same upward track in the early 2000s is evident across all four countries. What happened in 2000 that suddenly propelled house prices to start to leap ahead of what rents would suggest would be a fair price, in all four countries at the same time? Was it because we share a similar planning heritage?  Did all the main cities in these four countries suddenly bump up against their different urban limit lines at the same time,  while NIMBYs across the countries united at the same time into some sort of anti growth flash mob?  

Usually at this point in the story we get some sort of homily about markets (as per the following from the Market Urbansim website see note 3):

“In an unhampered market, of course, as rents rise, housing developers will respond by building more housing where it’s needed most — and thus potential prices are highest. Rents will then fall in those areas and developers will stop building housing — or build in other places — until rents rise again. Or, in response to rising rents, current homeowners will turn their homes into boarding houses. Others may build so-called mother-in-law suites over their garages. The number of ways to expand housing is actually quite long”.

For rents, read prices.

In an unhapmered market?

This is then usually followed by reference to the thicket of planning controls that restrict (hamper) supply.

In NZ, read some analysis and it suggests that zoning has always constrained supply and that by the early 2000s, the situation had become dire in Auckland at least, as the old ARC tightened the MUL noose around Auckland. Hence the rise in house prices. But by how much was housing capacity in Auckland constrained over the period around the turn of the century? The table below is from the ARC’s 2006 capacity for growth study (note 4). Between 1996 and 2006 housing capacity increased in the metro area, not decreased.   


Housing capacity (as measured above) grew faster than dwelling growth. The figures above are of  the ‘head room’ in the system. The capacity listed  is in addition to the existing dwellings. There was also a pipeline of rezonings that were underway or being investigated.

It can be argued that not all of the capacity measured in the 2006 (or earlier) study would be available for development. Not all of it might be commercially feasible, for example. A chunk of it was in town centres and business areas - possibly less attractive for buyers. Maybe more capacity would be better, but it seems a bit steep to say that the sudden rise in house prices in the early 2000s  is all down to bad planning.

Crucially if housing capacity was constrained relative to the growth of the population, then rents would have moved up at the same pace as house prices.

Brian Easton contends that the acceleration in the relative premium after 2001 coincides with President George W. Bush increasing the United States’ fiscal deficit which flooded the world with financial liquidity. That made it easier for New Zealand banks to borrow offshore using the cash to fund housing purchases.

Even the Market Urbanism article mentioned above refers to the possibility of asset inflation.

Certainly, a major factor behind growth in home prices is asset price inflation fueled by inflationary monetary policy. As the money supply increases, certain assets (like real estate) will see increased demand among those who benefit from money-supply growth. These inflationary policies reward those who already own assets (i.e., current homeowners) at the expense of first-time homebuyers and renters who are locked out of homeownership by home price inflation.

In March of 2017, The Economist magazine reported that since autumn 2014 $1.3trn of capital has flowed out of China. Some of that cash has found its way into residential property in some of the world’s most desirable cities.

But these explanations of rising house prices are not as exciting as an explanation associated with a so called regulatory failure.

Of course, lack of development opportunities in the right area could be a constraint on housing production and maybe part of the problem. So maybe a potential constraint on housing production is present (i.e. lack of development opportunities in some places), but that constraint may not be (and may never have been) the governing constraint.

Professor John E. Tookey of Auckland University of Technology in his Policy Observatory report: ‘The Mess We’re In: Auckland’s Housing Bubble from a Construction Sector Perspective’ puts it this way:

In any case, merely making more land available for development by selling Crown land, or permitting subdivisions, or easing green belt restrictions, will not radically change the market. Because no one is compelling land acquisition; no one is compelling development; no one is forcing builders to build. The market cannot be forced to operate at a loss, or at a rate of production it does not wish to operate at. Ergo, the consequence will be very limited increases in total output – in this case, constructed houses. The only way to increase the total number of houses constructed on newly available land is to compel its rapid development ahead of the market. Anything less simply allows the market to settle at an equilibrium that sustains prices and values at the limit of what is supportable by the general public. What that translates to, in reality, is that government needs to compel industry through the profit motive and economies of scale as they have done so in the past; specifically, by building council- or co-owned housing for low income households.


2, http://marketurbanism.com/2017/05/17/how-governments-outlaw-affordable-housing/
3. http://www.economist.com/news/finance-and-economics/21718511-bolthole-money-welcome-comes-unintended-consequences-foreign-buyers
4. Capacity for Growth Study 2006 March 2010 TR 2010/014

Wednesday, 7 June 2017

Neighbourhoods and inverse scaling

Time for a bit of theorising.

Many people have noted that as cities grow, some things get bigger at a faster rate than the city’s growth overall, while some things do not grow as fast. Urban scaling effects are seen in the productivity of workers, for example, and hence their salaries (and house prices). Larger cities are more productive than smaller cities. A doubling in size sees around a 10% to15% increase in productivity.

One summary of these scaling effects (Michael Batty from UCL - see footnote 1 ) identifies the following effects as being consistent across most cities:

  • As cities grow, the number of ‘potential connections’ increases as the square of the population (Metcalfe’s Law)

  • As they grow, the average time to travel increases

  • As they grow, the ‘density’ in their central cores tends to increase and in their peripheries to fall

  • As they grow, more people travel by public transport

  • As they get bigger, their average real income (and wealth) increases (the Bettencourt‐West Law)

  • As they get bigger, they get ‘greener’ (Brand’s Law)

  • As they get bigger, there are less of them (Zipf’s Law)

This is an interesting list, but not necessarily complete. An article in Nature by G West (who has written a book about scale effects) notes that as cities get bigger, per capita crime rates tend to increase faster than population growth, while infrastructure networks tend to decrease in their speed of expansion, both by the same factor.  For example, doubling the population of any city requires only about an 85% increase in infrastructure, whether that be total road surface, length of electrical cables, water pipes or number of petrol stations, yet  crime, traffic congestion and incidence of certain diseases all increase following the same ‘15%’ rule - see footnote 2.

The list is clearly relevant to Auckland.  Our current discourse on the city seems to be stuck on some of these ‘laws’, but not others. The government seems to like the idea that as Auckland gets bigger, wealth increases at a faster rate, but they do not seem so enamoured of the need to improve public transport. Meanwhile, we struggle to sort out how to manage intensification of the core, given the constraints present.

Public policy can 'bend' these scaling effects one way or another, but in simple terms the scaling effects are built into the urban system. However I do not want to discuss the above list at this point. What I want to do to is add another scaling effect. This relationship is:

“The relative multiplicity of units in a city is determined by an inverse-power law distribution.”

This scaling effect is raised in a book on cities and complexity written a while back by N Salingaros.

The basic idea that I take from this scaling effect is that as cities get larger, they need to generate more smaller ‘units’ to maintain coherence and functionality:  larger buildings and open spaces should be few, and increase in number as their size decreases, for example. As humans, we tend to relate more to the numerous, lower order scales than the larger, but fewer, units higher up the scale.

These units (or elements) may be neighbourhoods, centres/hubs, connections, buildings or the components in the design of buildings and spaces. These units, places and components are important to the functioning of cities. Modernist approaches to urban planning and architecture tended to strip out the smaller units in the pursuit of order and simplicity, but at the expense of complexity that helped to off-set the effects of increased size.

Salingaros contends that: ”The inverse power-law distribution…. is found in many natural and man-made structures. Smaller elements are thus more numerous than larger elements, with a fixed balance of distribution between sizes”.

As an example, he states:

“Overall, we have two peaks in the size distribution of components in a contemporary city, one corresponding to giant office and apartment buildings, and the other corresponding to suburban houses. There is relatively little of intermediate size, and almost nothing smaller than a suburban house that forms a coherent piece of the city. This contrasts sharply with the living urban fabric as measured in historic regions of cities”.

He proposed an equation to represent this relationship between different scales.

PXM=C

P = relative multiplicity
X = size
M = 1 < m < 2
C= constant

The idea can be applied to the number and type of centres in the city. For every large centre, there needs to be many more smaller centres. Here is the link to neighbourhoods and their relative abundance that I discussed in my blog of the 5 May 2017.

If we say that centres come in three scales - sub regional, town and local (neighbourhood) and correspond to the following sizes in terms of employment - 10,000; 2,500 and 500 - then if we set M in the above equation to 1.3, we get the following distribution (hopefully my maths is right):


Centre
Number
Size
sub regional
1
10,000
town
6
2,500
neighbourhood
48
500


Now I know that the above is purely theoretical.  The conceptual point is that as the larger units get bigger, there needs to be more smaller units generated to maintain a sense of coherence and stability to the urban system. If the sub regional centre increases in size to 15,000, then we need to following distribution.


Centre
Number
Size
sub regional
1
15,000
town
10
2,500
neighbourhood
83
500


Of course, the size of the other centres may also increase, while the value of M is very important to the distribution.  Salingaros doesn’t say what the value of M is, except it is between 1 and 2, which is not much help.

Putting aside the detail, I think the concept of non linear scaling of urban units is a useful one that is worth looking at more closely. I think it supports my contention that we need to think a lot more about the implications of population growth for all the urban scales, but particularly the abundance of smaller scale elements and the extent to which that abundance is constrained or enabled.  

  1. http://www.complexcity.info/files/2011/12/BATTY-Scaling-Laws-For-Cities.pdf
  2.  A unified theory of urban living. Luis Bettencourt and Geoffrey West. NATUREl 467, 21 October 2010.

Wednesday, 24 May 2017

Urban development authorities: be careful what you wish for

The following is a copy of my submission on the Urban Development Authorities discussion document put out by MBIE. It follows from my blog of the 17 February 2017 where I put down some initial thoughts. 


The proposal to set up a legislative framework for urban development authorities (UDAs) is potentially beneficial.

Such authorities will be given access to substantial powers in relation to:

  •     Planning and development control   
  •    Compulsory purchase of property
  •     Access to trunk infrastructure
  •      Funding and financing.
These are useful tools.

The two key issues I have with the proposals are:

1. What is the social / public benefit from having access to these powers?

2 How are the activities of the development agencies to be funded to ensure that they can take a long term, sustainable approach to urban development?

Public Good Outcomes

The discussion document seems to imply that it is more and faster housing development that is the social payoff from the special powers to be granted to UDAs. But is this sufficient justification for the deployment of these powers?

There is mention of social goods like affordable housing being part of the mix, but this is far from a certain outcome.

In my view the social dividends from the use of the powers listed need to be bolted into the legislation. In other words, use of the powers needs to be tied to the provision of demonstrable public benefit. To my mind this would cover:

  1.       A range of housing types and business/commercial spaces within a development (ie mixed           community outcome)
  2.          Direct provision of affordable housing with suitable retention mechanisms (i.e. equity outcome)
  3.          High quality urban design /place making (i.e. quality outcome).
  4.       Environmental restoration and enhancement (sustainability outcome).
Without these types of measures being required, it is possible (and in my view likely) that the UDAs as conceived will result in adverse outcomes for urban areas. These might include:

  1. Redevelopment  of lower income / lower value housing areas in the name of ‘renewal’ resulting in displacement of low income households and reduced access to affordable housing
  2.  Trading off the natural environment for more housing/businesses. For example, if not well specified, the plan making powers could be used to water down or remove rules that protect the natural environment, local heritage and important landscapes
  3.  Consumption of open space / reserve land for development. Open space land is often seen as a soft target for housing development (such as suggestions that publicly owned golf courses are re purposed for housing). Especially if funding for UDAs is limited, then there is likely to be great pressure on the UDA to find ‘soft targets’ to develop
  4.  Inefficient patterns of trunk infrastructure provision resulting in extensive infrastructure that is vested in / upgraded by councils and expensive to maintain into the long term
  5.  “Flag ship’ private development receiving a substantial subsidy in the form of public infrastructure funded by the tax payer or rate payer, such as new motorway extensions and interchanges, new schools, open spaces and the like, with that funding seen to be needed to ‘kick start’ marginal developments, potentially to the detriment of other areas that receive less investment, but which have higher needs.
These are not idle risks. Reviews of the use of urban redevelopment authorities in the UK have highlighted these unintended consequences. An example is the (now disbanded) Docklands redevelopment authority in London. As one review has put it:

Throughout the 1970s, the 5,500 acres of former dockland was a bone of contention. The Conservatives saw it as a national resource for private and public investment. Labour planned to build council housing on the derelict sites, but appeared to have no idea how to regenerate the Docklands economically. Ultimately, it was the former vision that won out, bringing in international interest via Canary Wharf and City airport, and introducing transport links via the Jubilee line and the Docklands Light Railway to make the territory more accessible to residents and visitors.

It fell short by placing too much emphasis on the private sector and not staying true to its original promise to the public sector. This is something the government needs to address with the regeneration of the Thames Gateway today, says McAuley. "It can create the conditions for the private sector to regenerate the economy of the area, but it must step up to the plate on issues such as education, housing and health."


The Docklands redevelopment did provide for many high end jobs and new, expensive apartments. These are good things, but there were costs involved:

  • an expensive tube line extension was funded by the public
  • affordable / social housing was lost
  • there were few jobs suitable for the local, less skilled population
  • much of the new public spaces created are in fact semi public spaces controlled by private landowners.
 Rowan Moore in his book Slow Burn City makes these points.

The above issues could be addressed by clearly stated public good objectives for UDAs which are part of the enabling legislation.

The discussion document states that “development projects will be required to achieve clearly-defined strategic objectives, which will be set by central government and territorial authorities when the project is established”. 

However, there is no statutory requirement to provide these outcomes, while the nature and extent of these ‘strategic objectives’ would appear to vary from project to project.

For example at page 19, there is the following statement:

These objectives can include requirements for public good outcomes (such as a certain proportion of social housing). A key strategic objective of all development projects will be to ensure the relationship of Māori with their land and other taonga is maintained. The choice of development powers must reflect those strategic objectives”.

However, the objectives may be as simple as ‘provide x number of houses, or y area of serviced land’. As an example, at page 25 it is noted that:

"In exchange for benefitting from the proposed development powers, the profits that private sector development partners seek can be offset by public good outcomes that the Government can require from the development project. These can be stipulated as part of the strategic objectives that the Government sets when enabling a development project. Potential requirements could include the volume of housing supply, the speed of delivery, better infrastructure, affordable housing and improvements to local amenities (such as investment in local heritage or installation of public artwork)".

To my mind, speed and volume of delivery and better infrastructure are not public good outcomes. These are private benefits which have a collective benefit, but these are not ‘public good outcomes’ in the normal sense of the word.

I think the lack of specification and requirement around public good outcomes is the major weakness of the proposal and needs to be addressed by appropriate objectives and outcomes included in the legislation. The need for clearly stated public good statutory goals is ever more important if the UDAs are to incorporate some form of public –private partnership. The discussion document notes:

Both private developers and publicly owned urban development authorities (or a combination) could access development powers for their development projects. However, in the case of private developers, even once the project has been established the Government proposes that they must apply to a publicly controlled urban development authority, who would decide whether to exercise the powers.

Without some clear specification of what is a public good and some form of cast iron agreement as to their delivery, it is not clear how any private developer who can access the required powers can be made to honour public good outcomes that may be established for the project.

Funding and Financing

There is plenty of evidence to say that good urban development (development that creates lasting value, which is sustainable and does not create problems for future generations) needs ‘patient capital’.

It is not clear at all how the funding arrangements for UDAs will work; how will the agencies be capitalised and the extent to which any agency will be expected to pay a dividend to government, should it receive funding from them?

The discussion document talks hopefully of a range of tools to raise capital, all of which appear to avoid direct capital injection by central government. There appears to be a hope that the agencies will be self funding. This approach does not inspire confidence.

Under the heading funding and financing, the discussion document states:

An urban development authority needs access to powers to independently fund new, and to upgrade existing, infrastructure systems and services, either directly or under contract with others. In particular, the Government proposes that the costs of developing new infrastructure be passed on to the eventual purchasers of individual properties and to any existing properties that benefit from the upgraded services within the development project area, either in the sale price or through a separate, targeted, property-based infrastructure charge.

There is no mention of funding to acquire and hold land, or to actually develop housing or business premises, apart from a vague reference to “receive and issue grants from the Crown and others”.

Land and housing development are very capital intensive activities. For example, the recently announced housing programme of the government to build around 2,000 homes per year in Auckland is reported to likely to cost upwards of $2.23 billion in the first four years and be funded through Housing NZ’s balance sheet and $1.1 billion of new borrowing that the Government has approved as part of the business case. This cost does not involve land costs and related infrastructure, as public land is to be developed.

One of the weaknesses of most urban development schemes is the inability to access long term capital. This severely hampers good outcomes. Short term demands to sell product tend to dominate.

The lack of any detail on the issue of capitalisation is baffling.

In terms of infrastructure funding, there is also some mixed messages.  As an example, a foot note at page 13 states that the Britomart transport centre was funded by land sales. If my memory serves me correctly, the council owned the land as it was reclaimed from the harbour and previously administered by the harbour board. But there is limited public land like this in Auckland. Hobsonville air base is a further example, but again it is a one off.

In relation to a user pays approach to infrastructure, I agree with the general principle, but note that in the past councils (to facilitate urban development) essentially ran an ‘average cost’ model to infrastructure provision.  While arguably leading to development in the wrong area, in the right areas development received a form of subsidy that helped deliver a degree of equity across urban areas in terms of the level and type of infrastructure provided.

Without this subsidy, many areas that the discussion document says should be developed may not be financially feasible to develop or will only  be feasible if infrastructure is stripped back to the bare bones. An example would be an area of high deprivation. Such an area will not attract a market premium, nor is it likely to be able to sustain a ‘user pays’ approach to infrastructure, given likely income levels. Alternatively the redeveloped area may only be able to sustain repayments if high deprivation is replaced by low deprivation, with the high deprivation population displaced.

Somewhat contradictory to the user pays approach to infrastructure funding, at page 74 the following comment is made:

The proposed legislation includes powers to require the relevant territorial authority to alter or upgrade any remote trunk infrastructure systems that are necessary to support the development project, if that work is not being undertaken by the urban development authority.

Extending trunk services is the major infrastructure cost involved in urban development, not local infrastructure within a development area. For example in the central Isthmus area of Auckland, the major trunk infrastructure that needs upgrading to cope with growth is the new central wastewater interceptor and the passenger transport system. Both of these are multi-billion dollar projects. These types of projects cannot just be ‘called up’ in the space of a few months and paid for by the Council out of current revenues.  Giving the power for the authority to require trunk infrastructure to be provided provides a very strong incentive for the authority to minimise its investment in infrastructure and raises major issues in terms of a user pays approach.

Considerable more thought needs to be given to the funding and financing of urban development authorities so that constrained funding or rapid financing agreements (quick pay back) do not end up 'driving' design and development proposals to the detriment of quality and sustainability. 

Friday, 5 May 2017

Auckland: a city of 300 neighbourhoods?


As the Auckland urban area’s population grows from 1.4 million  to 2 million by 2043 under a medium growth scenario, the perennial issue is where is everyone going to live. How are we going to fit in another 600,000 people? If we think that the option of greenfields (outwards expansion) is no longer so easy (see this post), and most of the growth will be by way of redevelopment of the existing urbanised area, then how should we conceptualise the further development of the existing urban area of Auckland?


In this blog I want to explore the concept of neighbourhoods and what this may mean for the redevelopment and intensification of urban Auckland. The Auckland Plan made the big pitch for urban redevelopment over urban expansion, while the  Auckland Unitary Plan has made room for the extra houses in a physical sense, based on its approach of intensification around centres. I don’t intend to traverse over that ground.  


05052017085909-0001.jpgWhat I want to do  is look at a different way of conceptualising the city and its growth. Neighbourhoods play an important role in urban form and design and well functioning neighbourhoods deliver a whole host of social and economic benefits, but they are also a problematical concept as they can be used to create metaphorical walls around communities and be used to counter integration and mixing.


But if we start with the premise that people live in neighbourhoods and generally identify with a particular neighbourhood, then we start with a different picture of the city. The picture is not of large centres and connecting transport corridors, but rather one of  a complex mosaic of shapes.  (The diagram to the right is from a session that Auckland Council’s urban design team held on the Auckland Plan, of which I was part).


The question becomes as to whether and in what way will future growth change neighbourhoods. Will they get bigger, more densely developed, or will existing neighbourhoods split and divide into new neighbourhoods as growth occurs?


Some new neighbourhoods will be greenfields areas, some will emerge in former industrial areas, others will be in residential areas that infill and redevelop and where neighbourhoods will change and adapt.  


How many neighbourhoods does Auckland currently have? Perhaps 200. Why 200? No good reason. A google search of how many neighbourhoods in Auckland gives a list of 220 places. If we drop off 20 to account for rural townships and  peri-urban neighbourhoods, then 1.4m divided by 200 equals an average of 7,000 people per neighbourhood.  Some are bigger, others smaller. Does another 600,000 people mean another 80 to 90 neighbourhoods?


Of course it all depends upon how you define neighbourhoods. Is it a physical thing - an area with distinct geographic boundaries; is it presence of a range of local services (the corner store or the local supermarket), or is walkability to the local primary school or park?  Or is it about the similarity of building types and densities?


I think it is all of the above. But with twists on the theme. For example, there is an argument that runs that neighbourhoods don’t need a commercial centre in their middle to work. Commercial activity can be on the edge of a neighbourhood, perhaps on a main road that sits between two neighbourhoods. Neighbourhoods should have a diversity of building stock, not a uniformity; they need porous edges, not walls. Should we think more strongly about reserves and open spaces and primary schools helping to define the structure of neighbourhoods, than transport and centres?  


Below is a diagram from a classic text on neighbourhood planning - Clarence Perry from the 1920s: shopping on the edges, 10% open space, a primary school at the centre. Perry’s concept was of a neighbourhood of 7,000 to 10,000 people. Times have moved on - should it be the retirement village in the middle of the neighbourhood, rather than the school?
New_York_Regional_Survey,_Vol_7.jpg


As presented by Perry, the neighbourhood is seen as a bit of an island surrounded by big roads. Too insular a view? Perhaps. But I dont think that makes the concept invalid.

The Auckland Plan and the Unitary Plan have tended to promote growth around existing town centres and along transport corridors. But are these really neighbourhoods?


Further population growth has the potential to strengthen existing neighbourhoods, but also to see a more complex neighbourhood structure develop over time. The latter prospect is not one that gets much attention in planning, but I think is the hidden benefit of urban intensification.   Perhaps increased density should be located not in areas where it reinforces current transport routes and commercial services, but where new growth can help expand the range of variety of neighbourhoods in our suburban areas.


Take a look at any suburban area, and the opportunities to  develop a more dense network of neighbourhoods is evident. Below are some examples.  
Eggs.jpg


Granted, some neighbourhoods may have a constraints - like heritage building stock - that limit further growth. The above examples are of the middle ring, where opportunities are greater.

In planning we tend to concentrate on the big centres - the sub regionals like Albany, Westgate and Manukau. Growth is concentrated around these centres, and the next layer down - the town centres. But should we also look at the neighbourhood level. If we go from 200 to 300 neighbourhoods, each with their own clustering of mixed use activities, terraces and apartments, adding 600,000 people gets broken down into more manageable chunks. Some new neighbourhoods are formed, others augmented and strengthened. Thinking about another 100 local neighbourhoods being formed and 200 being added to also changes our frame of reference when we think of  infrastructure.