Monday, 20 September 2021

NPS-UD Back to the Future

The draft proposals for the Natural and Built Environment Act, as well as documents like the National Policy Statement on Urban Development spark thoughts about the extent to which town planning is kind of turning full circle and coming back to its roots. 

Often it is interesting to look back to see what previous planning schemes aimed to achieve, in times when planning was more overtly about city building, rather than 'effects management'.  

The map below is from the 1961 district scheme for (the old, pre amalgamation) Auckland City. The city hugged the coastal edge; inland where the boroughs like Newmarket, Mt Eden and Mt Roskill.


The plan was prepared under the 1953 Town and Country Planning Act.  The general purpose of district schemes under that Act (section 18) was managing the development of the area to which the scheme relates (including, where necessary, the replanning and reconstruction of any area therein that has already been subdivided and built on) in such a way as will most effectively tend to promote and safeguard the health, safety and convenience, and the economic and general welfare of its inhabitants, and the amenities of every part of the area.

Maybe the proposed Natural and Built Environment Act could take a lead from this purpose statement: planning is about development and redevelopment, but in a way that promotes health, safety, convenience, welfare and amenities, not just more houses.   

The map shows three residential zones – B (yellow), C (brown) and D (orange). Not too sure what happened to the Residential A zone. It looks like the western side of Ponsonby (along the line of John Street, St Marys Bay and Arch Hill were all in the Residential C zone, along with Parnell. The ‘D” zone was confined to the eastern edge of the Central Area.

Other zones included a Burnt Cray Products Zones (in Avondale) while the Freemans Bay ‘Reclamation’ area looks rather ominous.
 
The zone  framework for B , C and D was pretty simple. 

Dwelling houses, semi-detached houses and apartment houses where possible in all three zones. So plenty of housing choices.  "Apartment house" meant any residential building which contains two or more household units and includes a block of flats. An apartment building did need a site with an area of 24 perches (about 600m2) in area. 

Maximum height of buildings went from 30 feet (9m) in Residential B zone, to 50 feet (15m) in Residential C and 100ft (30m) in Residential D. A simple graduation of height away from the central area was foreseen. No need for density in the suburbs.  

Building coverage in Residential B zone was 40%, but corner sites could go up to 50%, while rear sites where 30%. In the Residential C zone this coverage increased to 50%, 60% and 40% respectively. 

Density for residential buildings was limited to 50 persons per acre in the Residential B zone. This rose to 100 persons per acre in Residential C zone and 200 persons per acre in the Residential D zone. 

It is not clear from the scheme how residential density was measured at a site level. A rough guess is 50 persons per acre is equal to 6 or 7 dwellings per hectare in the B zone, and 13 to 14 dwellings per hectare in the C zone. 

In a rough sort of way, the zoning pattern in the 1961 plan is what the National Policy Statement on Urban Capacity is trying to achieve – more density close to the city centre. So if the 1961 scheme had been implemented, with Ponsonby and Parnell sprouting 3 to 4 storey apartment buildings and Symonds Street with 8 storey apartments, would we have the housing crises of today? 

Special Character was yet to be identified as a matter that should constrain redevelopment. The inner suburbs were yet to be gentrified, and if anything, there was concerns that Ponsonby may turn into a slum, so redevelopment was seen to be a good thing. Certainly Freemans Bay was seen as an area in need of redevelopment. Hence the special development area. 

The NPS-UD doesn't think much of Special Character. How would Auckland look if the 1961 scheme had been followed through? Perhaps it is a good thing that there is always a gap between aspiration and reality in planning.  

Retention of the inner suburbs has forced a focus on residential intensification in the central area, as well as in the suburbs outside the inner area. These are not bad outcomes.  Could it be said to be a win-win-win? Character retained, a busier Central Area and more activity in the outer suburbs?


Wednesday, 14 July 2021

Natural and Built Environment Act

The disclosure draft of the Natural and Built Environment Act is out for comment. What does it mean for urban design and urban environments?

In short: the natural environment gets ‘environmental limits’; the urban environment gets ‘flexibility’? 

The new Act will all be about positive outcomes, backed up by a monolithic sounding National Planning Framework.

Outcome (k) of the draft Act is:

Urban areas that are well functioning and responsive to growth and other changes  including by enabling a range of economic, social and cultural activities and ensuring a resilient urban form with good transport links within and beyond the urban area.

How will this outcome  be translated into the required National Planning Framework? What is a well functioning urban area - one with lots of choice and lots of competition between developers, landlords and owners?  Good transport links - something big and fast with lots of capacity? A motorway for one city and a rapid transit system for another? As for resilient urban form, resilient to what?

Top of the head comment would be that urban design has not found its way into the outcomes, despite the Randerson report seeking quality urban environments. Previous communication had said urban design would be pursued. Well, no sight of it in the disclosure draft.

Perhaps the National Planning Framework? But clause 13 does not list the quality of the built environment in its list of compulsory matters. 

The Parliamentary Paper that accompanies the exposure draft mutters darkly about ‘subjective' amenity assessments. Such matters will be banished! 

The new world order is about clear and defined 'limits' (and by implication clear and defined 'no limits'). Wishy washy urban design doesnt fit this mould.

Setting limits

The bill and the associated commentary feels very reactive - “the RMA failed to deliver a better natural environment and made urban environments worse and this is how we think we can patch up the failures of the last 30 years: We will set limits! 

But environmental limits could be set under the RMA and have slowly crept in. Section 6 of the RMA tried to set a bunch of 'limits', as did the Coastal Policy Statement. You could say that the National Policy Statement on Urban Development set another type of limit - a limit on low density development near rapid transit. So limits are not necessarily a new concept. 

The real questions  are how to set the limit - where to draw the lines - and how strong will the limit be? Does the new act help in defining limits? Apart from saying that the National Planning Framework may sort things out, there is a dearth of guidance on how to set limits and who is going to be involved in this process. Where do the incentives to set limits lie? 

Under the RMA it was mostly a regional council function to set environmental limits - regional councils were supposed to be the environmental watchdogs. But very few did set limits because most regional councils are dominated by rural interests who had limited interest in setting limits. Furthermore, new  stressors on the environment are often not easy to anticipate. Was the ‘dairy conversion’ boom of the early 2000s anticipated by any plan?  So limits often come in after the fact when it is hard to claw back lost ground.  

Limits may be set by the national planning framework or (more likely) left to regional planning committees. Will a Combined Plan prepared by a regional committee better support limit setting? One theory might say a combined plan is more likely to see limits watered down as room is made for necessary development and economic change.  The old Auckland Regional Council had an urban base and it tried to set an environmental limit in the form of the Metropolitan Urban Limit. The limit soon got turned into a stretchy rubber band. Much will depend upon the final make up of the regional planning committees that will formulate the new plans. Where will the balance of power lie?  Perhaps the membership of the committee should be on a population weighted basis. Does there need to be some form of independent public good defender in the mix? And how to represent future generations? 

And what about restoration and enhancement of degraded environments? The stronger call these days is to fix up inherited problems, rather thsn just stop new ones developing. What are the mechanisms to restore environments? 

Where is urban design?

The absence of any reference to the quality of the urban environment is a stunning (but deliberate?) omission. Given 85% of us live in towns and cities, and the built environment is so important to people’s health and well being and sense of safety you would have thought that the government would be worried not just about the stability of the financial sector from skyrocketing house prices, but also the impact of urban environments on police, education, health and social welfare budgets.

We have come a long way in a few years. Dial back to a National lead government and a 2010 discussion document on building competitive towns and cities. The following was stated:

If poorly managed, economic growth and our responses to it can have negative impacts. This poses a challenge for growing towns and cities: that is, how to enhance the positive outcomes that come from a high quality, liveable, economically productive natural and built urban environment, while mitigating or avoiding negative consequences, such as congestion or adverse impacts on the natural environment. 

Good planning and urban design can play a significant role in delivering and maintaining the high quality urban services and amenities, including public space, which are crucial to cities’ long-term attractiveness and competitiveness and quality of life. 

However, the environmental effects-based nature of the RMA, as the primary land-use planning legislation, does not easily allow this. In an urban context, the RMA has limited capacity to adequately consider the value created by urban development and good urban design compared to what already exists, or to support positive impacts of development on the built environment, beyond effects on amenity values. In particular, RMA practice emphasises the management of the effects on the natural environment. Creating and managing an urban environment which may not already exist, or is in the process of being created, is assessed in the same way as the existing natural environment. This tends to encourage a reactive, risk-averse approach that seeks to maintain the status quo, regardless of wider benefits which may be achieved from what is proposed. As such, the RMA does not effectively facilitate the achievement of long-term, efficient and integrated planning and urban design outcomes.  

So we have shifted from good planning and urban design helping to support liveability and economic development to no planning and no urban design being the best way of supporting liveability and economic growth? And this under a Labour government? 

The fear of the political power of the NIMBY to block any growth or change seems to have spooked the writers of the bill. Best to go around them, rather than try to placate them with vague references to good design. So much for public participation as a corner stone in any environmental management system. But perhaps more importantly, references to more  choices and good transport links between cities could just generate a whole new round of sprawl, big boxes and haphazard apartments, rather than the hoped for clean, green compact city that supports greenhouse gas emissions and reduces per capita demands on infrastructure spend.  How does the NPS-UD match up with outcome (K) and (L)? 

Too many outcomes?

As many have noted, the list of outcomes in section 8 of the exposure draft is long.  There is no hierarchy as there is with sections 6 and 7 of the RMA.  No guidance is provided on the resolution of conflicts. What gives when one outcome butts up against another - infrastructure needs to cross a significant natural area;  an urban area wants to push out into good soils? Limits will be breached. Supporting more choices for consumers in the range and type of housing to be enabled is a good thing, provided it occurs within a solid framework Okura didn’t get urbanised because of the landscape values present and the Plan (and the Act) saying that the landscape values were important enough to keep. Would the new section 8 ‘protect’ Okura, given landscapes are a human construct not a bio physical thing and will not be subject to a limit? 

Section 8 feels like an attempt to sell the Act to both sides of the debate as a win-win.  Under the RMA the narrative was that for the environmentalist, adverse effects on the environment will have to be mitigated; for the developer, you can go anywhere provided you mitigate your effects. The language may have changed to limits rather than mitigation but the message seems the same: resource users will be limited by limits,  but limits will be limited in their scope. 

Setting aside the big conflicts between development and protection, what about the nitty gritty of a new taller building being inserted into a low rise suburb? Any guidance on how to address this, what effects to take into account or discount, how to rate and evaluate different effects? Rather than simplify things by trying to say most ‘urban’ effects are no longer relevant, I get the feeling that the absence of direction will just amplify debate and discourse, rather than resolve conflicts. 

Plans will never be able to resolve all conflicts.  The hope that many activities will be permitted or prohibited is unlikely to play out. There will always be a larger middle ground of probably/possible activities. The mechanics of consent decision making will be critical.


Thursday, 27 May 2021

Well functioning urban neighbourhoods


Do we need well functioning neighbourhoods rather than well functioning urban environments?

As the RMA reforms take shape (or not), the question of the purpose of urban planning is no doubt going to be debated. Currently, the proposed objective of the new planning act appears to be well functioning urban environments. Whether this is well functioning in social, economic and environmental terms is yet to be sorted.

But is the ideal of a well functioning city too broad to offer much guidance as to what is the rationale for much urban planning and asscoiated interventions?  

While spatial planning may deal with the big picture items of city structure, it is down at the neighbourhood level that things happen. It is at this level that many small, incremental changes occur, some for the better, some for the worse. 

Should the proposed Spatial Planning Act deal with well functioning urban areas and the Natural and Built Environment Act aim to support well functioning neighbourhoods? At the neighbourhood level, urban planning is more about urban design, cumulative effects and people’s day to day interactions with their environments. It is not about urban expansion versus intensification, or about nodes and corridors.  

The neighbourhood has long been a core element of city planning. The concept of the residential neighbourhood could be said to be one of the greatest inventions of urban planning. The amenity (and stability) benefits provided by a neighbourhood where potentially incompatible activities are constrained or actively excluded are important and shouldn't be taken for granted. But neighbourhoods are complex things. We need a more sophisticated understanding of neighbourhoods and how to manage them. 

There are many signs that neighbourhoods are important to social and economic outcomes: 

  • Well functioning neighbourhoods build social capital
  • Covid has given a boost to working from home and probably soon for many, working for part of the week at least in your neighbourhood. 
  • As the population ages, then the neighbourhood needs to accommodate people as they age in place
  • As economies decarbonise and travelling longer distances gets more expensive, then people are going to become more reliant on their  local environment in meeting their needs
  • Mental health is supported by a high qaulity public realm in the neighbourhood. 

But how do we define what is a well functioning neighbourhood and how do we get across the notion that for all neighbourhoods, there will always be a degree of change? 

Two concepts with some contemporary currency are:

  • The complete neighbourhood
  • The 15minute neighbourhood

These can be described as neighbourhoods where one has safe and convenient access to the goods and services needed in daily life. This includes a variety of housing options, local stores and other commercial services, public open spaces and recreational facilities, affordable active transportation options and civic amenities. An important element of a complete neighbourhood is that it is built at a walkable and bikeable human scale, and meets the needs of people of all ages and abilities.

The 15 minute neighbourhood is all the rage at the moment. The new London Plan has the concept as a core idea - people should be able to access most services and activities they need within a 15 walk, bike or bus ride. The core principles of a 15-minute city are said to be:

  • Residents of every neighbourhood have easy access to goods and services, particularly groceries, fresh food and healthcare.
  • Every neighbourhood has a variety of housing types, of different sizes and levels of affordability, to accommodate many types of households and enable more people to live closer to where they work.
  • Residents of every neighbourhood are able to breathe clean air, free of harmful air pollutants, there are green spaces for everyone to enjoy.
  • More people can work close to home or remotely, thanks to the presence of smaller-scale offices, retail and hospitality, and co-working spaces.

But perhaps this is too much of an insular view of neighbourhoods. Neighbourhoods need to interconnect and overlap. The big benefit of cities is the agglomeration benefits of many people coming together from many different neighbourhoods. But nevertheless people identify with their neighbourhood. As Jane Jacobs says:

But for all the innate extroversion of city neighbourhoods, it fails to follow that city people can therefore get along magically without neighbourhoods. Even the most urbane citizen does care about the atmosphere of the street and district where he lives, no matter how much choice he has of pursuits outside it, and the common run of city people do depend greatly on their neighbourhood for the kind of everyday lives they lead.

Well functioning  neighbourhoods have a degree of self organisation to them - people look out for one another. They invest time in their local house, street and local community to the benefit of all. 

Planning for well functioning neighbourhoods is different from handing planning over to the locals (neighbourhood planning). It is also not about stopping change. But here is one of the great paradoxes of neighbourhoods - how to build social capital through stability while allowing for the inevitable ebb and flow of city growth. Back to Jane Jacobs:

To be sure, a good city neighbourhood can absorb new comers into itself, both newcomers by choice and immigrants settling by expediency and it can protect a reasonable amount of transient population too. But these increments or displacements have to be gradual. If self government in the place is to work, underlying any float of population must be a continuity of people who have forged neighbourhood networks.  These networks are a city’s irreplaceable social capital. Whenever the capital is lost, from whatever cause, the income from it disappears.  

What are the remedies to maintain social capital while allowing change: 

  • Good streets
  • Active frontages
  • Mix of uses
  • Older and newer buildings
  • Gradual change.

How does planning support these qualities? Perhaps the biggest issue to get right is the last one. To quote Jane Jacobs yet again:

City building that has a solid footing produces continual and gradual change, building complex diversifications. Growth of diversity itself is created by means of changes dependent upon each other to build increasingly effective combinations of uses. All city building that retains staying power after its novelty has gone and that preserves the freedom of streets and upholds citizens self management, requires that its locality be able to adapt, keep up to date, keep interesting, keep convenient and this in turn requires a myriad of gradual, constant, close grained changes.

So rather than have policies that say:

“that the planned urban built form in … RMA planning documents may involve significant changes to an area, and those changes: (i) may detract from amenity values appreciated by some people but improve amenity values appreciated by other people, communities, and future generations, including by providing increased and varied housing densities and types; and (ii) are not, of themselves, an adverse effect”

Perhaps they should say: 

“that changes to urban built form that involve gradual, constant adjustments that increase the diversity and complexity of uses and buildings in communities are not, of themselves, an adverse effect, but rather are a positive effect that should be supported”.


Tuesday, 2 March 2021

Urban planning and the reform of the RMA 2


RMA reform proposals have taken another step with release of the programme for the reform and associated Cabinet papers. The press release that accompanied the programme says that the new Natural and Built Environment Act will be more focused on natural environmental outcomes and less on subjective amenity matters that favour the status quo. Better urban design will be “pursued”. 

What that means for urban environments is not clear.  

The image below is snipped from the Cabinet paper on the reforms. It is part of the proposed section on "outcomes". The new Act will all be about achieving positive outcomes.  

Reference to the features and characteristics that contribute to urban quality is crossed out. So too is sustainable use of the built environment. Outcomes for the built environment are listed as:

  • Sufficient development capacity
  • Housing supply and choice.

Will urban design just be tacked onto the calls for more urban land and greater housing capacity ?  But well functioning urban environments are not the same as well functioning land and housing markets that produce lots of nice looking houses.

To put it somewhat differently, a market economy is not the same as a market society. To borrow someone elses words (see Note 1):

The difference is this: A well functioning market economy is a tool—a valuable and effective tool—for organizing productive activity. A market society is a way of life in which market values seep into every aspect of human endeavor. It’s a place where social relations are made over in the image of the market.

What is needed to ensure well functioning land markets is increasingly redefining what is a well functioning urban environment. But where do qualities like all neighbourhoods providing mixed uses, accommodating mixed incomes, providing accessible and safe open spaces and streets, fit in? We may moan about terms like character and identity, but these subjective qualities are vital to a modern city  where most jobs are involved in services (including tourism and events), creativity and 'technology'. These qualities will not spring forth from a well functioning land market. In fact they are qualities that can easily be eroded as markets seek to devour the public realm. 

Why such a focus on market-based processes to defining urban outcomes? Part of the appeal of markets is that they don’t pass judgment on the preferences they satisfy. They don’t ask whether some ways of valuing goods are higher, or worthier, than others. 

To this could be added that markets do not arbitrarily pick winners and losers through administrative decisions; markets also collect and process lots of information quickly.   Back  to the article quoted above:

This nonjudgmental stance toward values lies at the heart of market reasoning, and explains much of its appeal. But our reluctance to engage in moral and spiritual argument, together with our embrace of markets, has exacted a heavy price: it has drained public discourse of moral and civic energy, and contributed to the technocratic, managerial politics afflicting many societies today.

While a bit strong perhaps, somehow we need to draw a line between the urban economy and urban society. Urban planning and urban design is not just about ensuring efficient urban economies, it is also about supporting well functioning urban communities.

We live in cities because of the social and economic benefits that they bring. It is easy to let slip the conditions that support social benefits and focus on the economic. Granted, lack of affordable housing is a social issue as much as it is an economic issue, but rendering down of urban planning to the one act of ensuring sufficient supply of housing opportunities presents a very bleak view of urban planning and urban communities.  Are urban communities so dysfunctional that they shouldn't be given tools to help shape the social life of  cities? 

Does the RMA reform proposals take forward the debate about where the boundary is between well functioning urban economies and well functioning urban communities? Will the new Act support the type of planning needed to deliver the patterns of urban land use set out in the National Policy Statement on Urban Development - 6 storey apartments close to centres and transit lines? That level of urban intensity needs good, detailed design and a strong 'partnership' between public and private space.  It also requires a degree of 'micro-management'. Urban environments are all about small incremental changes - positive and negative. Will  the Act allow for consideration of these cumulative effects?

Firstly, under the new Act, it looks like urban environments will need to operate within bio-physical limits. The Cabinet paper states that environmental limits have become ‘bio physical’ limits. These limits cover freshwater, coastal waters, air, soils, biodiversity, and terrestrial and aquatic habitats. Bio physical limits help support well functioning urban environments. But this is just a stronger articulation of the bottom line approach to management of the natural environment  that was part of the RMA. It is not a new approach. 

Long-standing social constructs of outstanding landscapes, historic heritage and coastal environments are to be recognised in the new Act.  But these constructs result in limits on urban development and expansion.  This is section 6 of the RMA re-housed.

Is the call for ‘outcomes’ a recognition of the need for something more than a well functioning urban land market that operates within bio physical limits? But what are these outcomes to be achieved?

Management of the built environment seems to be stripped back to ‘more housing options, more quickly’ . The Cabinet paper explains :

The Panel recommended listing as an outcome the enhancement of features and characteristics that contribute to the quality of the built environment’. While it was not the Panel’s intention, I consider the inclusion could perpetuate subjective amenity values hindering development. This has therefore been removed from Appendix One. 

However I do recognise that urban design considerations do contribute to well functioning urban areas. These matters are more appropriately addressed at a lower level in the NBA such as through the National Planning Framework. 

Hopefully, this statement means that urban design is not seen to be a bunch of subjective assessments of amenity. This is a step forward, but perhaps urban designers better quickly redefine what they mean when they refer to character and identity’. Of course it is possible to jazz up ‘character’ to refer instead to the scale, massing, grain and rhythm of the built form, or something similar. 

Is the reference to well functioning urban areas (rather than markets) a hint of a wider scope for planning and urban design? But will outcomes extend down to the small scale matters like front fence heights, building set backs and front doors being visible from the street, features which contribute so much to the quality and functionality of neighbourhoods?   

Finally, the strategic integration of infrastructure with land use is basically the same as Sec 30 of the RMA: “the strategic integration of infrastructure with land use through objectives, policies, and methods”. That injunction hasn’t got us very far. There is always the fear that anything too directive about ‘integration’ will mean that land use development will be held up by slow infrastructure roll-out, rather than infrastructure supporting fast roll out of urban development.  

So is the end result more market and less society?  Feels that way. 

Note 1: https://www.theatlantic.com/magazine/archive/2012/04/what-isnt-for-sale/308902/

Thursday, 21 January 2021

Urban design and reform of the RMA

Some more thoughts on the replacement to the RMA and the possible role of urban design in the new Act. A central feature of the reform panel's report on the RMA is the call for 'urban quality'. Does the call for urban quality not place urban design in the centre of the action? 

First up, urban planning has always responded to the pressures of the day:

  1. The Victorian city and its densely packed housing close to polluting industry. The planning response: separate out land uses and control housing density
  2. The post war city of motorways, suburbia and subsidised sprawl - response: better protect the natural environment (streams, bush, landscapes), develop sub regional hubs, structure planning
  3. The post industrial city of the late 20th Century of infill, redevelopment, gentrification and consumerism - heritage zones, design controls, tree protection, view shafts, mixed uses (which is where urban design started to come into focus).

The interesting thing is how each wave has added layers of response onto previous layers. Is the  panel’s call for urban quality a further iteration of this trend of addition, or is it a replacement of  accumulated layers?

But either way are quality urban environments what we need to respond to today’s urban pressures and issues? Constrained supply of housing and too many road blocks to urban redevelopment are seen to be the pressures of the day, pushing up house prices. In one view, in response market forces should become more prevalent in the determination of land use location, density and mix. This will help ensure sufficient and adequate supply of housing, apparently. The call then goes out to make sure it is quality development - where ever and what ever it is.  This will keep the NIMBYs at bay. But does 'quality urban environments' sound like a very middle class aspiration? 

But why do we think market processes will not deliver quality. And what happened to overall urban functionality, equity and long term efficiency?

I'm  a bit worried that the RMA reforms will play out along a simple dichotomy:

Better protect the natural environment, but loosen up on the urban areas. 

People like simple solutions and this one always sounds fair and balanced. More rules and intervention in one sphere, but less in another.

But loosen up in the urban sphere? Loosen up may be right for some circumstances. It is time to have a look at the accumulated layers, and perhaps remove some, but new layers need to be developed to deal with future issues.

The trick to any RMA reforms will be in defining the limits of planning in an urban context. There are defined principles to limit market processes as they relate to the natural environment (bottom lines, fair allocation within limits, managing use of public resources), but come to the urban environment and there are much less clear cut boundaries. The RMA attempted to control urban planning by limiting intervention to the management of externalities. But that never limited constant calls for more planning to control and promote outcomes. Defining the role of urban planning has to involve some sort of consensus on how far it can go.  The call for ‘quality’ is a simplistic response to this need, and will lock debate about urban planning into a very narrow field.   

In previous posts I have looked at urban design and how it relates to plans developed under the Resource Management Act. Urban design has come along way in the past 20 years, but has struggled to find a ‘home’ under the RMA. This is because the qualities and characteristics of urban environments that support social and economic well being are much wider than just managing negative externalities. They are also much wider than a simple notion of 'quality'. Good urban environments are complex:

  • People’s interactions with the built environment is physical, emotional and cerebral
  • Interactions are both positive and negative.
  • They tend to be small-scale, cumulative and accumulate
  • The public-private interface is critical
  • Open space, mixed uses, housing choices, connectivity are all critical to well functioning urban environments.

If anything, todays urban pressures are all about addressing a narrowing of urban choices (the downsides of a more market - or less government - approach?). Equity is being eroded, long term consequences are being downplayed and choices narrowed as private space takes over from public space. There is a growing concentration of urban resources in fewer and fewer hands and a longer tail of people and neighbourhoods being left behind. The old technique of a strong public sector to counterbalance the pressures of a strong private sector no longer works. Calls for more competition to help rein in the concentration of private interests and improve market-based choices tends to see concentration increase, rather than get dispersed.  More housing supply is not translating into more supply of modestly priced housing, for example. 

 How do these thoughts match up with the proposed replacement RMA? Lets start with the purpose:

(1) The purpose of this Act is to enhance the quality of the environment to support the wellbeing of present and future generations and to recognise the concept of Te Mana o te Taiao. 

Wellbeing is wide ranging: 

 In this Act wellbeing includes the social, economic, environmental and cultural wellbeing of people and communities and their health and safety.

Promotion of quality urban environments sounds like a more comfortable starting point for management of urban environments than avoidance and mitigation of adverse effects.  Depends on the outcomes of course. But can a quality urban environment deliver a healthy and safe urban environment for all, for example? Is the reference to 'quality' too confining? Shouldn't a safe and healthy urban environment that can be enjoyed by all be an objective in itself?   So too with housing choice and affordability.  

To achieve the outcome, the review report on the RMA suggests a shift towards outcomes. 

(2) The purpose of this Act is to be achieved by ensuring that: 

(a) positive outcomes for the environment are identified and promoted; 

(b) the use, development and protection of natural and built environments is within environmental limits and is sustainable; and 

(c) the adverse effects of activities on the environment are avoided, remedied or mitigated. 

The obvious problem is that positive outcomes are to be ‘promoted’ while negative effects are avoided or mitigated. Avoidance and mitigation are a lot more definitive terms than ‘promotion’. How are positive outcomes to be ‘promoted”? Promotion involves some sense of active facilitation, but perhaps no more than some marketing. Are positive outcomes to be promoted by enabling them to occur, but not requiring them? 

But then, what is a positive outcome? Is it an improvement over the current state? Is more choice a positive outcome? 

What is meant by the word 'environment'?

(3) In this Act environment includes– 

(a) ecosystems and their constituent parts; 

(b) people and communities; and 

(c) natural and built environments whether in urban or rural areas. 

So promotion of positive outcomes can include something positive for a community? Is a shared sense of place/identity through the coherent design of the built environment a positive outcome (like a Special Character Area, but then dont these special character areas lock up supply options?). 

To assist in achieving the purpose of this Act, those exercising functions and powers under it must provide for the following ‘outcomes’:

Built environment:

(f) enhancement of features and characteristics that contribute to the quality of the built environment; 

(g) sustainable use and development of the natural and built environment in urban areas including the capacity to respond to growth and change; 

(h) availability of development capacity for housing and business purposes to meet expected demand; 

(i) strategic integration of infrastructure with land use.

So does promotion of environments that support urban well-being get reduced to "lots of  capacity for ‘quality’ development?". 

I think this bit of the possible Act needs serious consideration. 

There needs to be some form of definition or explanation of features that contribute to the functionality of the built environment, of which quality is one aspect. This is very wide ranging, spanning from sense of safety to aesthetics with everything in between. 

The built environment is also a vast space covering public, private and semi public/private spaces. Should the reference to qualities be more confined to the public components of the built environment (streets, open spaces, public buildings) or perhaps to the public areas and their interface with private spaces? 

There is a danger that the more comprehensive attempts to incorporate positive outcomes become, the less defined the outcomes become and less support is provided to their incorporation. The alternative is to take up the language of bottom lines and limits and say that developments in urban environments should incorporate some basic features that support quality public environments and do not detract or reduce these values.   

And by the way,  the strategic integration of infrastructure provision with land use and development has to be  linked to funding arrangements. Structure plans and rezonings should only be advanced after infrastructure needs, costs and funding obligations have been determined and agreed. Otherwise, there is not going to be any 'integration'.  


Sunday, 22 November 2020

Working from Home Part 3

In my previous post on working from home I speculated on the residential locations that might be affected by a large take up of people working from home. There is conjecture that freed from having to travel daily into central workplaces, and the associated long commutes and high house prices, many office-based workers will spread out into the countryside as they look for a better home-work balance. Of course, to make it all work, most people in the household would need to be able to work from home; not much use relocating to the countryside if one member of the household can work remotely, but the other is tied to a desk in a central city workplace. The down side of more working from home could be a quieter central area and reduced passenger transport use. 

Census data suggests that many current ‘work-from-homers’ live in high amenity suburbs in the central Isthmus and along the eastern seaboard of the city, and so may see little point in shifting to somewhere else. But maybe newer households to be formed by people that can work from home will think differently about where to live in the future, especially if housing is cheaper in towns further away from the main urban area? In particular, will small towns within 2 hours drive of Auckland see an upswing in demand? Places like Muriwai, Warkworth, Matakana, Waiuku, Raglan and Waihi Beach? Why two hours? It is a doable trip in a day if you have to go into work one day a week, or for an in-person meeting. 

It is early days and any trend towards the growth of 'satellite' townships may be a few months off.  The question of how big the trend may be remains unclear. 

Census data suggests that outer lying townships have higher rates of working from home than the main urban area. 2018 data suggests that about 12% of workers who live in Warkworth work from home, up from the 9% for the region as a whole.  

Google mobility data (note 1) gives us another perspective on the impact of Covid 19 on the city and people’s movements, and with it some possible clues as to what may happen.

The data shows how visitors to (or time spent in) categorized places have changed over the past 6 months or so, compared to a baseline, being the median value from the 5‑week period Jan 3 – Feb 6, 2020.

The mobility data is created with aggregated, ‘anonymized’ sets of data from users who have turned on the Location History setting on their mobile phones, which is off by default. The data is presented as the percentage change from the baseline value. 

Data is available for the Auckland Region as a whole. No sub regional data is published. 

Data is presented for six types of activities:

  • Retail and ‘recreation’
  • Supermarkets
  • Public reserves
  • Transit stops
  • Workplaces
  • Residences. 

First up, the 'retail and recreation' catrgory is useful to look at to see how the data is presented. The graph below shows the percentage change in visits to retail places in the Auckland Region, from the per covid baseline data. The pattern of a steep fall off in visits to retail premises in the first lockdown is clear, along with a smaller fall in the second lock down. 

(Note: In all the graphs, the data is presented as a % change on the 'baseline' and is for the Auckland Region - as defined by Google)


The google data suggests that visits to retail premises are back up to pre covid levels. However, the data can't tell us about visits to specific retail areas. 

If we compare the Auckland region with the Wellington and Canterbury regions, we can see the dip in the Auckland region in the 2nd lock down, but not Wellington or Canterbury, so the data looks pretty good. 

Before I look at the data on workplaces and residences, spare a thought for Melbourne. The below graph shows Auckland and Melbourne. 

Turning to whether the data shows any trends as to working from home, the data on visits to workplaces and residences tend to be a mirror image of each other. Visits and time spent in workplaces in the Auckland Region took a big dip during the first lockdown, and then another, lesser dip in the second lockdown. 

The one off, downward spike in late October was Labour weekend. 

The baseline data period used in the analysis was over our summer break (January), so the baseline may be an incorrect measuring point for workplace visits. Certainly looking at the graph, the period mid February to mid March (pre lockdown) was about 20% above the January baseline. If we take the mid Feb to mid March period as being the relevant baseline, then mid October is about 20% below the early February period, with workplace visits more akin to a ‘holiday period’.  The period between the two lockdowns is also at this lower level, suggesting a more than temporary reduction in workplace visits. Having said that, it is not clear from the google data if visits to tertiary educational facilities were counted as workplace visits. 

Turning to residences, the baseline data seems a better starting point, with the mid February to mid March period about the same as the baseline period. Time spent in residences was 5 to10% higher than the baseline during the period between the two lockdowns.

The smaller increase in time spent in residences compared to reduced time spent at workplaces is possibly due to the overall larger number of people likely to be at home, once students are added in. 

The big surprise in the Google data is use of ‘transit stops’. Use of transit is well below the baseline, at least 40% down. Is this the flow on effect of the 20% reduction in workplace visits? Perhaps it is reasonable to say that many of the people who would be working from home were public transport users who would likely benefit the most from not having so long to commute in the morning and evening. 

Google says that Transit Stops covers subway stations, ports, taxi stands and highway rest stops. So a mixed bag.

To complete the picture, what about parks and open spaces? Surely a big rise in visits during the lockdowns? But the figures suggest otherwise. Maybe the cancellation of organised sport is reflected in the figures. 


A reduction of 20% in workplace 'visits' as recorded by google may mean that all workers are working from home for one day a week. But it is likely that working from home will be concentrated in certain groups. NZTA (see note 2) suggests that in Auckland, in November, about 18% of workers are mainly working from home, well down on the peaks during the lockdowns, but higher than pre-lockdown (when about 9% of workers were working from home - which is close to the census data).  

So what if an extra 5 to 10% of future workers did think that they could work from home, and therefore live outside the Auckland urban area?  

Forecasting employment is difficult in the current circumstances. Between 2015 and 2020, the Auckland region added about 110,000 jobs. This is a fast rate of growth. If the next 5 years saw a similar growth, then about 10,000 workers may decide to locate elsewhere. This may equal about 6,500 dwellings. This may mean big growth for little towns, but not much of a difference for Auckland.  

But what happens if, say, 8% of existing workers decide that the accpetance of remote working means that they can shift out of the urban area? In 2020, there were just over 807,000 jobs in the region, so lets say 686,000 are in the urban area (85% of total). 8% of this number is 55,000, or perhaps 84,500 people. This  means about 28,000 dwellings may come 'free'.  

As for the Central Area of Auckland, the below graph is from the Heart of the City website (see note 3).  It is based on real time counts of pedestrian traffic near the foot of Shortland Street. Shortland Street has a grouping of high rise office blocks. Data for the period 17 to 21 November suggests an average predestrian count of about 250 people per hour in the mid afternoon, well down from the 700 people over the same time last year.  The twin mountain peaks of lots of people out at lunch time and after work are replaced with a smooth low rise 'hill'.  

The pedestrian data and public transport use data suggests a major shift in land use patterns within the city may be underway. Equally, it may be that the Auckland urban area sees a period of population decline over the next few years. 


Notes:

1. https://www.google.com/covid19/mobility/

2. https://www.nzta.govt.nz/assets/resources/covid-19-impacts-on-transport/waka-kotahi-nzta-COVID-19-tracking-core-report-wave-23-20201117.pdf

3. https://www.hotcity.co.nz/city-centre/results-and-statistics/pedestrian-counts


Friday, 16 October 2020

Has the housing deficit gone?

The RMA is again being blamed for soaring house prices. There is a ‘shortage’ of houses, with this shortage caused by restrictive zonings and district plans that are slow and cumbersome to change. But is it all a bit of a supply myth? 

For example ASB bank’s recent flyer on housing says that a “second factor we believe is behind the housing resurgence, a more severe housing shortage. It now looks as if the shortage that developed over the past five years was larger than most appreciated. We’ve updated our estimates of such to reflect Stats NZ’s recently upgraded population estimates. The upshot is that NZ’s long running residential construction under-build has produced a shortage of around 60-65k houses, around twice what was previously assumed”.

But as I have pointed out a number of times (as have others), a lot depends on how you calculate the shortage, and what you assume to be a reasonable response between demand (population growth) and supply (a dwelling being built). 

Previously I have looked at issues like:

  • Possible over estimaiton of migration flows and population growth
  • The composition of demand, and the extent to which recent population growth has been driven by migration and uncertainty around the intentions of younger people on worker visas
  • The lag between population growth occurring and houses being built. Evidence is that there is at least a two to three year gap between a building permit being issued and a completion certificate being signed off.

Time to have another go. 

Statistics NZ have updated their yearly estimates of population growth in the light of the 2018 census. So I thought it would be good to re-run the numbers on demand and supply. I have done this for the two ‘hot’ property markets of Auckland and Queenstown.  

Stats NZ provide an annual estimate of resident population for all Council areas. The most recent set for 2020 says that the estimated resident population (ERP) of each area is based on the 2018 Census usually resident population count, with updates for:

  • residents missed or counted more than once by the census (net census undercount)
  • residents temporarily overseas on census night
  • reconciliation with demographic estimates for ages 0-14 years
  • births, deaths, and net migration between census night and the date of the estimate.

The estimated resident population is not directly comparable with the census usually resident population count because of these adjustments.

Stats NZ have completed an intercensal revision for estimates between June 2013 and June 2018, to reconcile with the estimated resident population 2018-base. This has seen some downward revision of previous estimates.

Based on these recent estimates I have attempted to estimate housing demand and supply over the period 1997 to 2020. A long time period is needed, as plannnig is a long term process.  

As previously noted,  a range of assumptions need to be made. 

First up, demand for housing is based on annual population growth divided by the average number of people per occupied dwelling. The average number of people per occupied dwelling can be calculated at the time of each census, as follows: 

Table 1: Auckland and Queenstown dwellings and resident population


2006

2013

2018

AK - occupied dwellings

438,609

472,044

498,789

QLDC - occupied dwellings

9,090

11,190

13,719

AK - resident pop

1,373,000

1,493,200

1,654,800

QLDC resident pop 

24,100

29,700

42,500

This data gives me the following average number of people per occupied dwelling.

Table 2: Auckland and QLDC people per occupiued dwelling 

Year

2006

2013

2018

Auckland

      3.13

    3.16

  3.32

QLDC

       2.65

    2.65

  3.10

Some people at this point suggest that the rise in the average number of people per dwelling is not an independent variable. It is a sign of rising unaffordability as people share living spaces due to high housing costs, when the trend should be for fewer people per dwelling (more choice and more space). Others have pointed out that in Auckland at least, other changes like a younger population and possibly more multi-generational households formed by migrants helps explain the increase. 

For example, for Auckland, there has been a dramatic change in the composition of growth, and with it likely demand for housing between the 2000s and 2010s.  The graph below shows the change in the number of residents by age band, from 1996 to 2018. Through the mid 1990s to mid 2010s, the dominant group were the high income earning 40 to 64 year olds, many of whom would be looking for a ‘new home’. From mid 2010s, the largest group by far are the younger 15 to 39 year olds, many of who may be living at home or in flatting type situations, or after a second (or more) hand home. 

Figure 1: Demogrpahic change - Auckland Region 

This change in demographics must change housing markets, reducing demand for new homes to buy, slowing the flow of homes into the stock of housing, while at the same timing raising the demand for existing houses. 

To determine demand, I have used the above data from the census on people per dwelling. Spreading out these rates on an annual basis leads to an estimate of demand for dwellings. 

Supply is based on building permits issued. Building permits issued does not necessarily accord with the number of dwellings that are consented by way of RMA processes. There is no reliable way of counting how many ‘RMA consents” for new dwellings are issued each year. It could be that dwellings enabled by the planning system in each year is way ahead of building consents issued. 

For this exercise, I need to run off building consents. Supply of new houses is based on the number of building consents issued in the two years after the estimated demand. That is, I have assumed that there is a lag between population growth occurring and house plans being drawn up, building permits obtained and houses built. In other words, the number of houses built in any year will likely reflect what demand was at least two years prior. So matching annual population growth with building permits issued in that same year is miss-leading. 

However, some building permits for new dwellings will involve the removal or demolition of an existing dwelling. Comparing the increase in the number of dwellings (occupied and unoccupied) counted by the census with the number of permits issued in the preceding period (but lagged by you years to account for time to complete a building) gives me a guide as to how many permits are for replacement dwellings. My estimate is that in Auckland, 94% of permits are for new dwellings (not replacements). 

Table 3: New dwellings versus building consents for dwelling units

Auckland 


New Dwellings

2001-2006

2006-13

2013-18

2006-18

52,087

33,465

32,778

118,330


Permits

1999-2004

2004-11

2012-17

2005-17

47,710

50,323

27,398

125,431

New dwellings as %

of permits issued

109%

67%

120%

94%

The data suggests some unders and overs. For example between 2006 and 2013, 33,465 dwellings were added to the housing stock in Auckland, yet in the period 2004 to 2011, over 50,000 building consents were issued. A large number of consents must not have been actioned, or they took much longer to complete than 2 years. 

In my analysis I have used the average for the period 2001 to 2018. 

In Queenstown, the net addition rate is closer to 97%.

Table 4: New dwellings and building consents for dwelling units - QLDC


New Dwellings

2006-13

2013-18

2006-18

2,727

3,483

6,210


Permits

2004-11

2012-17

2004-17

4,157

2,237

6,394

Permits as % of new dwellings

66%

156%

97%

Next allowance needs to be made for ‘unoccupied’ dwellings - second houses, holiday homes and the like. In Auckland, census data suggests that of the total housing stock added between 2006 and 2018, 10% were unoccupied dwellings. In QLD it is more like 25%. Unoccupied means clearly not occupied on the night of the census. 

Table 5: Occpied dwellings - Auckland and Queenstown 


2006-13

2013-18

2006-18

AK

Total new dwellings 

33,465

32,778

66,243

Occupied

33,435

26,745

60,180

% Occupied

99.9%

81.6%

90.8%

QLDC

Total new dwellings

2,727

3,483

6,210

Occupied

2,100

2,529

4,629

% Occupied

77.0%

72.6%

74.5%

To put it together, for example in 2016 to 2017, the population of Auckland City grew by 35,300. At a ratio of 3.29 people per household, this equals a demand for 10,740 new dwellings. In 2019, building permits for  13,754 dwelling units were issued. Assuming that 6% involved replacement of an existing dwelling, then 12,929 new dwellings were added to the stock (net growth). Of these 91% were for occupied dwellings, or 11,745 dwellings. This then equals a surplus of 1,005 dwellings. .

Below is the graph of the annual demand and supply from 1997 to 2018, for the Auckland Region. There is a ‘deficit’ over this period of 14,000 dwellings.  The last 10 years (1999 to 2018) has seen a deficit of 3000.This is a lot less than the 30, 000 to 40,000 sometimes bandied about. 

Figure 2: Auckland region: estimated housing demand and supply

The recent upward swing in building permits for new occupied dwellings suggests that the housing market is responding (as has the RMA). The deficit really built up in the post GFC period, and then it did take a while for the new build market to respond to the fast population growth between 2013 and 2018. 

The accumulated surplus/deficit looks quite large, when graphed. See below. Since 2017, substantial inroads have been made.  

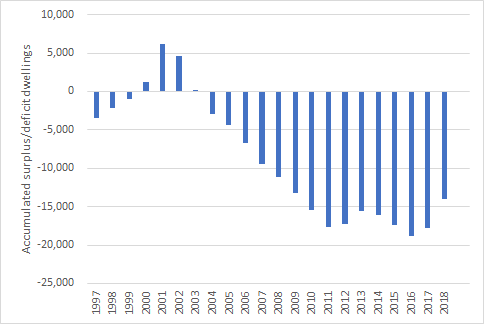
Figure 3: Auckland Region housing surplus/deficit


The same exercise can be  undertaken for Queenstown Lakes District. Here there is a closer match between demand and supply, with some divergence over the period. Is this divergence enough to explain the large increases in house prices seen over this period?  

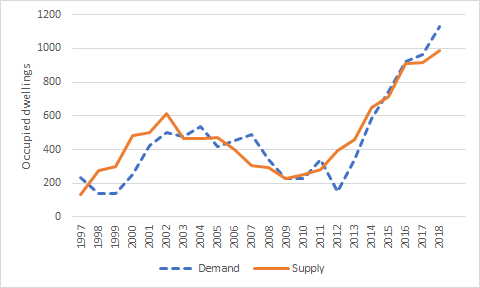
Figure 4: Queenstown Lakes District demand and supply estimate


There is an accumulated surplus of 480 dwellings, using the methodology set out above. 


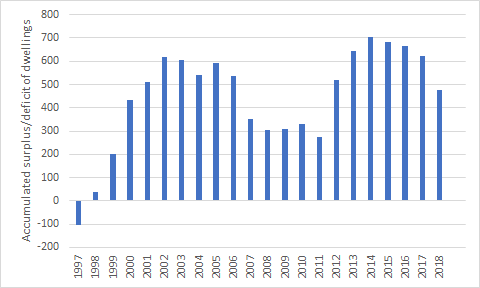
Figure 5: QLDC housing surplus

Is there a supply myth? And if it is all a bit of a myth, what is the implications for the reform of the RMA and implementation of instruments like the National Policy Statement on Urban Development? 

Planning needs to keep adding new capacity for more dwellings and businesses, but adding more capacity will not necessarily bring forward more affordable houses for households on low to moderate incomes.  Urban quality is also important, and shouldn't be left behind in the dash for more capacity.