 Note: the photo to the side is not related to the development.
What I want to look at is the decision making involved in planning issues at a project level, using car parking as a case study. But rather than leap into an argument about on-site car parking requirements being unnecessary and often harmful to a bunch of urban outcomes, I want to take things step-by-step.
The development is in an inner city suburb of Auckland. It is on a large site in a neighbourhood of villas. 19 units of a variety of sizes are proposed on a 2,400 square metre site. There will be 5 studio/one bed units, 7 two bedroom units and 7 three bedroom or larger. The site is in a special character area with a Single House zone underlying. 9 on-site car parks are proposed. The relevant district plan rule says that one on-site car park should be provided per dwelling, so there is a 'shortfall' of 10 on-site car parks. The streets in the area are well used by residents and visitors parking their cars. The site is near two busy bus routes and within walking distance of a supermarkets, cafes and other shops.
The issue is whether the lack of on-site parking is significant? A lot of the concern generated by the development is that the shortfall will put too much pressure on the kerb side parking resources in the area.
What I want to look at is how might you go about considering the effects of the ‘shortfall’, what is a significant parking effect, for example?
To start with, do you look at the effect first and the nature and scale of the effect, then turn to the objectives and policies in the district plan to work out if the effect is significant? Or should you first look at the objectives and policies to see if pressure on street parking is actually an adverse effect to be managed?
In this case, as we the know that the plan has requirements about on-site parking, I will start with the ‘effect’. Then look at the plan to see if the effect is important or not.
What the actual effects of the shortfall are, is a bit hard to work out. Given the so called short fall of 10 on-site car parks, most people immediately assume that the effect must be that generated by demand for 10 on street parks. But is that right?
The plan requires development to contribute to parking supply in an area. If sites provide one on-site car park, then the plan assumes that all other car parking demands generated by the activity are OK. A house may be occupied by 2 adults and 5 teenagers and have 7 cars, but so long as one on-site car park is provided then there are assumed to be no adverse 'car parking' effects that the plan intends to manage. There is nothing wrong with this. There will always be some 'overs and unders' across a street, with some houses having lots of cars and other none or only one. Plus plans need to draw lines between things being 'OK' and when things 'needs to considered".
So one question is whether ‘effects’ are just related to the 10 on-site car parks not provided, or should effects be related to all of the car parking generated by the development, given that the on-site parking standard is not met?
In this case, I think it is the total quantum of parking that is relevant, not just the short fall from the relevant rule. But this is not the end of the story. Should the likely use of the cars also be relevant? Car parking is really only part of the picture as we know. The effects have to be judged against an environment. How ‘sensitive' or 'valued’ is that environment? Can it (the environment) cope with the estimated impact? Is the environment changing anyway?
It is also necessary to judge the effect against what may happen if the project does not proceed. The site will not stay as it is. Something will happen.
In other words, to understand the effect we need to estimate as best we can:
- The size of the effect, with and without the project;
- The nature of the effect
- The state of the receiving environment; and
- The significance of the effect to that environment.
If we look at the stats on car ownership, then in the Auckland Region at the 2013 census, the average number of cars per household for the region was 1.71.
Table 1: Average number of cars per household
Area
|
2001
|
2006
|
2013
|
Region
|
1.60
|
1.70
|
1.71
|
Locality of development
|
1.52
|
1.61
|
1.58
|
So 19 households means on average 32 cars at 1.71 per household. However the locality of the development is a bit different to the region as a whole. Bus services are good, while finding space to park cars is harder - sites are smaller and were developed in pre-car days. Zero in on the locality, and the average is 1.58 cars per household, or a total of 30 cars. I have taken the three census area units that surround the site as being the locality. They cover an area within about 1 km radius of the site.
You could say that there is a regional benefit from locating the 19 houses in the locality - 2 fewer cars on the region’s roads, on average, than if the 19 houses were located further out. Not a big benefit, but then a lot of planning is about small incremental changes. However, a regional benefit might be outweighed by a local dis-benefit.
If we use the locality average (which recognises lower than regional averages for car ownership), then there will be 21 cars looking for a street parking space (30 minus 9 on-site).
Interestingly, the average number of cars per household has gone up for the region as a whole between 2001 and 2013, but for the locality, there is a slight drop between 2006 and 2013.
However that drop in the average does not mean fewer cars in the area. The number of houses went up, so the total number of cars in the area climbed. Figure 1 shows the pattern between 2001 and 2013. Perhaps this could be called the background level of growth. Even if the housing development in question didn’t happen, there would still be more cars looking for a space to park, into the future.
Figure 1 Number of residents cars in the locality

But the increase was not large. Between 2006 and 2013 the estimated yearly increase in the number of cars in the locality of the development was 17. This increase is spread over a large area.
Within the average number of cars per household, there is a spread between some households with no cars and some households with lots of cars. Just looking at 2013, you get the following pattern:
Figure 2 % of households by number of cars
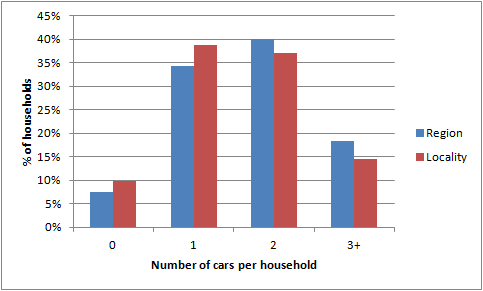
The locality has more households with no cars or only one car, compared to the regional average.
If we take the 2013 averages for the locality and apply those to the 19 dwellings, then based on those averages we get the following spread.
Table 2: estimated number of cars by household
Number of cars
|
0
|
1
|
2
|
3
|
Total
|
% of total households (2013 locality)
|
10%
|
39%
|
37%
|
15%
|
100%
|
Number based on 19 dwellings
|
1.87
|
7.35
|
7.02
|
2.76
|
19
|
Number of units (rounded)
|
2
|
7
|
7
|
3
|
19
|
Number of cars
|
0
|
7
|
14
|
9
|
30
|
This suggests that 2 units will not have any cars to park, while 7 dwellings need just one car park. Half the houses generate most of the on-street demand.
As we know, in the locality the average number of cars per dwelling reduced between 2006 and 2013. Looking at the numbers, the average dropped due to a greater proportion of one car households. The number of households with no cars declined, as did the number with 2 or 3 or more.
Table 3: Proportion of households by number of cars, 2006-2013, in the locality
Number of cars
|
0
|
1
|
2
|
3+
|
% of households 2013
|
9.9%
|
38.7%
|
36.9%
|
14.5%
|
% households 2006
|
10.2%
|
36.4%
|
37.5%
|
15.8%
|
Change 2006-2013
|
-0.4%
|
2.3%
|
-0.6%
|
-1.3%
|
If we carry on this trend through to 2018, then we get the following figures:
Table 4
Number of cars
|
0
|
1
|
2
|
3+
|
Total
|
2018 % of households (estimated)
|
9.5%
|
41.0%
|
36.4%
|
13.2%
|
100%
|
Number of households
|
2
|
8
|
7
|
2
|
19
|
Number of cars
|
0
|
8
|
14
|
6
|
28
|
A reduction in total number of cars of two, from the 2013 numbers. The off-site demand falls to 19.
28 cars over 19 households is an average of 1.47.
At this point we could also extrapolate forward the increase in the regional average of the number of cars per household seen between 2001 and 2013. This would suggest a even bigger difference in car ownership if the 19 units were located further out. Perhaps a difference of 5 cars, for example.
The proposed housing development has a range of dwelling sizes within it, and one of the arguments is that that range will generate different parking demands to the average. I do not have any data on the number of car parks per the number of bedrooms in a dwelling, for example. What I do have is the number of bedrooms per dwelling in the locality.
The development will have a total of 43 bedrooms, or an average of 2.26 bedrooms per dwelling. For the locality, in 2013, the average number of bedrooms per dwelling was 2.79. The development is about 80% of the average in terms of the number of bedrooms.
Should the estimated total parking demand of 28 then be reduced by 20% to reflect the different number of bedrooms between the locality average and the proposed development? A 20% reduction results in 22 cars. If 9 are parked on-site, there will be 13 off-site. I think this is reasonable.
We also have data on the number of cars per household income. The following table shows the average number of cars per household, by household income, for 2013. The figures for the locality are provided alongside the Auckland Region. Not surprisingly, as incomes rise, car ownership goes up with it.
Table 5
HH Income
|
Locality
|
AK Region
|
$20,000 or less
|
0.62
|
0.93
|
$20,001 - $30,000
|
0.76
|
1.05
|
$30,001 - $50,000
|
1.14
|
1.36
|
$50,001 - $70,000
|
1.28
|
1.60
|
$70,001 - $100,000
|
1.44
|
1.85
|
$100,001 or more
|
1.98
|
2.23
|
And here is a graph of the percentage of households in each income band. The locality has a larger proportion of high income households than the region as a whole, but lower car ownership, which is interesting.
Figure 3 Household income 2013
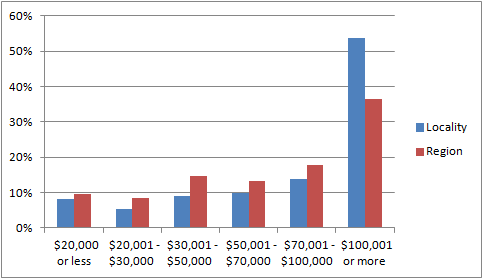
There is a noticeable difference in car ownership rates between households in the $70,000 to $100,000 band and the 'more than $100,000' band. Should that be taken into account? Is it reasonable to assume that being a new development it will attract people in the $70,000 to $100,000 band, for example?
I think that allowing for the number of bedrooms helps to address the issue of the difference between the development and the average for the locality in terms of the likely number of cars, better than trying to second guess the income of the households in the development.
Perhaps at this point we should call it quits on the data front.
One final task is to try to work out what may happen if the site is not used for the proposed development; if it was developed for housing more similar to what is in the area, that is stand alone houses. Sites in the area are in the order of 450 sqm to 500 sqms. If we took 450 sqm as being a realistic lot size, then the 2,400 sqm site could accommodate 5 sites. It is likely that these 5 sites will have 3 or 4 bedroom homes built on them. The average number of occupants will likely be higher. As a result car ownership may be a bit higher than the average for the locality. If we say that the 3 bedrooms per dwelling is about 110% of the locality average of 2.8 bedrooms per dwelling, then car ownership may be about 1.7, or 9 cars rounded up. If one on-site space is provided, then there would be demand for 5 off-site spaces.
This is not a ‘permitted baseline’ type exercise, as strictly speaking, I think you would need consent to have a lot size of 450 sqm. Having said that, this still seems a reasonable assumption.
So what is the summary:
- The total number of cars with the project would likely be 22.
- With the project there will be an off-site demand for 22-9 = 13 street parks
- Without the project, there may be 5 dwellings with 9 cars between them, or an off site demand of 4.
- The difference between the with and without project scenario may therefore be about 9 cars in the locality looking for an on-street park, and 13 more cars in total driving along local streets.
- Elsewhere in the region, without the project, there would be 14 dwellings, perhaps with about 17 cars between them. Four more than the with project scenario.
Table 6: Summary
Locality
(no of cars) |
Elsewhere in region
(no of cars) |
Total cars
|
Locality on-street
parking demand | |
With the
project |
22
|
0
|
22
|
13
|
Without the
project |
9
|
17
|
26
|
4
|
Difference
|
13
|
-17
|
-4
|
9
|
In comparison to the without project scenario, the locality may see demand for 9 extra on-street car parks, but 13 more cars driving on local streets, while the region as a whole sees 4 fewer cars on the road due to the lower car ownership rate from dwellings being in the locality. A regional benefit, but possibly a local cost.
I will not get into too much detail as to how the various cars may be used and their contribution to effects like emissions and congestion, safe to say it is reasonable to say that being located close to the centre of the region with workplaces and shops close at hand, the cars used by residents of the development are likely to be used less than if those residents lived in places less proximate to jobs and services.
It is possible to take a stab at these matters, at least in relation to travel to work. We know from Stats NZ data the following info, for the locality and as a comparison, a newly developing area on the outskirts of West Auckland (with train access). The percentages are the percentage of trips to work by residents of the two areas, on the day of the census. The distance is the average of the one way trip to work for all residents in the two areas, using all means of travel.
Table 7: Journey to work data, 2013
Journey to work
|
PT, walk, cycle
|
Car
|
Distance (kms)
|
Locality
|
27%
|
73%
|
3.79
|
Elsewhere
|
10%
|
90%
|
9.61
|
Being close to the centre, people in the locality use cars less to access work and their journey to work is about one third of the distance of people living further out. I haven't looked at the demographic make up of the two areas and if that explains anything about trip patterns.
What about the receiving environment? What is the impact of 13 extra cars looking for an on-street space and 22 more cars on local streets?
Presumably this parking demand will be felt in a small area, within 100 to 200m of the site, as most people want to park their cars close to their home. Block sizes are modest in the area. Short blocks tend to increase the amount of kerb space relative to housing numbers,
On-street car parks are generally in high demand from residents, visitors and possibly commuters.
The lots in the area are about 13m wide, meaning that for each lot with a 3m wide driveway, there is usually space for 2 car parks on the street outside each lot, if they “squeeze up”. Parallel parks are usually about 6m long , so a 13m wide lot with a 3m wide vehicle crossing means 10m of kerb length before the next crossing point - technically not enough to fit two cars in, especially if a car owner casually parks in the middle of the 10m space between two vehicle crossings.
Often vehicle crossing are not evenly spaced, while there will be yellow lines close to intersections as well as other interruptions.
The following is an attempt to calculate the number of on-street parking spaces available for a 150m long stretch of road. The figures are all an estimate.
Table 7: Estimating street-based parking supply
Length of road (metres) within which demand for
kerb side parking will be experienced |
150
|
Total kerb length (two sides)
|
300
|
Average lot width (metres)
|
13
|
Total lots (existing dwellings)
|
23
|
Car ownership per dwelling - average
|
1.6
|
Total cars
|
37
|
On-site car parks (say 0.9 per dwelling -
allows for a a couple of sites to have no on-site parking) |
21
|
On-street demand from existing residents (cars to be parked) -
total cars less on-site parks |
16
|
Vehicle crossing widths (metres)
|
3
|
Total kerb frontage taken up by vehicle crossings (metres)
|
69
|
Other interruptions to kerb (metres) - say 20% of total kerb frontage
|
60
|
Available kerb space (metres)
|
171
|
Kerb length occupied by car (metres) - allows for a casual
approach to car parking |
7
|
Residents demand for kerb space (metres)
|
113
|
Available kerb space (metres) for visitors, new residents
|
58
|
Car parking spaces for new residents
|
8
|
In this case, I have estimated demand for 13 on-street spaces and estimated that 8 spaces are ‘free’. This is probably a generous estimate of free spaces, given that lot widths may mean restricted space to fit in two cars outside each lot.
As an aside, one car parking survey that I have seen for the area suggests that for about a total of 1,200m of kerb length along a number of streets, there are 122 car parking spaces available, or about 1 space per 10m of kerb length. The above estimate has 24 spaces over 300m or one space per 12.5m of kerb space. If there was 1 space per 10m, then the 300m stretch of road would provide 30 spaces, perhaps 16 of which would be occupied by existing residents, leaving 14 for new comers.
Commuters are also increasingly parking in the streets, while there is also a smattering of small businesses in the area who have visitors. However I cant find much information about these demands.
Is it possible to say anything about the parking effects if the 19 dwellings (or the 14 not provided for should a scaled back development occurred on the site) had to locate elsewhere in the region? Would they generate more or less of a parking effect? Hard to say. Logic might suggest less of a parking effect if the 14 dwellings located on larger sites with more space for on-site parking. But then many new subdivisions have limited on-street parking, so maybe not.
Auckland Transport's parking policy says that competition for street parking in inner suburbs causes stress for residents: "A lack of available on-street parking impacts significantly on local residents and their visitors, and AT receives regular feedback regarding this". That is fine as far as it goes, but we are talking about a public resource.
What is reasonable to say is that the effect on the receiving environment is not just about competition for limited street parks, there is also a flow on effect to the wider neighbourhood amenity. Streets lined with cars are not a bad thing, the parked cars can visually narrow the roads and slow traffic down. But cars can get parked across driveways, and where do you put your rubbish wheelie bin on collection days if there is no free kerb space? More importantly, does the lack of street parking start to affect how sites in the special character area are developed and redeveloped? Is there going to be an incentive for existing villa owners to squeeze in a garage under or beside the house? Or do they get fed up, rent the house out and shift to somewhere with more parking, letting the character villa to get run down?
What can I say about the 'parking' receiving environment in the locality:
- On-street parking is a scarce public resource.
- We know that car numbers have increased in the area over the past 10 years and will continue to do so as sites get developed and car ownership rates vary.
- This must mean that there is a gradual take up of on-street parking spaces
- For prospective residents of the new development, the lack of on-site car parking and the difficulties of finding an on-street park may mean that households with no cars select to live in the development ahead of those households with lots of cars; that is, the effect on the environment maybe self limiting, to a degree.
- For existing households in the area, there has never been a guarantee that they can always park their car on the street outside their house. They have never had a claim on the space, but may have just got used to there being a space over the past 10 or 20 years.
- The scale of the change - being one larger development, rather than incremental change - also makes a bit of difference to the perception of impact.
- The extra demands for car parking spaces and associated difficulties of finding a spot may mean that existing residents try to incorporate more on-site car parks, perhaps affecting to a degree, character and amenity of the area, or they themselves may give up a car due to the hassle, and take the bus or buy an electric bike.