
The following is a thought experiment after reading Bruecknar’s book: Lectures in Urban Economics. In his book Brueckner has a chapter on the durability of capital and its implications for patterns of redevelopment.
If we start by assuming that buildings have a useful life of 75 years, then the height of the building will reflect the land values at the start of the building's life (ie 75 years ago), not what land values might suggest after 50 or 60 years of existence. When the building ends its useful life, and it is time to pull it down and rebuild, land values will have changed (assuming a growing city). The new building will likely be quite a bit taller than what previously stood on the site.
Lets further assume we have a city that starts from scratch. In the first 25 years of its life it expands to fill a 1 km radius. The average age of buildings in 12.5 years. The 1 km radius is not a set number, it is just a convenient figure. It could just as well be 1 mile or 1 city block.
The below table has the first growth period.
Table 1; the first 25 years
Years
0-25
| |
Distance
1 km
| |
12.5 average age of buildings
|
The city continues to grow over the next 25 years. The city expands out another 1 km. The buildings in the central km get older, their average age is now 37.5 years, while the buildings in the next ring out are on average 12.5 years.
Table 2: The next 25 years
Years
| ||
Distance
|
0-25
|
25-50
|
1 km
|
12.5
|
37.5
|
2 km
|
12.5
| |
This pattern repeats itself over the next 25 years. A further 1km is added to the city's radius. The buildings in the central 1km are now 62.5 years old, and getting towards the end of their useful life.
Table 3: Up to 75 years
Years
| |||
Distance
|
0-25
|
25-50
|
50-75
|
1 km
|
12.5
|
37.5
|
62.5
|
2 km
|
12.5
|
37.5
| |
3 km
|
12.5
| ||
What happens in the next 25 year period?
The city expands outward more, but the first 1 km is redeveloped. The average building age exceeds the 75 year life span. Here the average age of the building drops back down to 12.5.
Table 4: 0-100 years
Years
| ||||
Distance
|
0-25
|
25-50
|
50-75
|
75-100
|
1 km
|
12.5
|
37.5
|
62.5
|
12.5
|
2 km
|
12.5
|
37.5
|
62.5
| |
3 km
|
12.5
|
37.5
| ||
If we repeat this pattern some more, then by 5th, 25 year period, the buildings in the second ring out (2 kms) are redeveloped.
Table 5: Redevelopment
Years
| ||||||||
Distance
|
0-25
|
25-50
|
50-75
|
75-100
|
100-125
|
125-150
|
150-175
|
175-200
|
1
|
12.5
|
37.5
|
62.5
|
12.5
|
37.5
|
62.5
|
12.5
|
37.5
|
2
|
12.5
|
37.5
|
62.5
|
12.5
|
37.5
|
62.5
|
12.5
| |
3
|
12.5
|
37.5
|
62.5
|
12.5
|
37.5
|
62.5
| ||
4
|
12.5
|
37.5
|
62.5
|
12.5
|
37.5
| |||
5
|
12.5
|
37.5
|
62.5
|
12.5
| ||||
6
|
12.5
|
37.5
|
62.5
| |||||
By the 7th period, the buildings in the first 1 km are ready for their second round of redevelopment. There is a successive wave of redevelopment, with the highlighted cells in the above table being the periods of redevelopment.
Of course development and redevelopment is never this tidy a process, but it is the concept that counts at this stage.
If we then assume a land value increase in each 25 year period as the city grows, then we begin to see how building height may not have a smooth profile from the centre to the edge.
The table below lists land values - these are made up values and are not realistic figures. They assume a constant rise in values. The highest values are always in the middle of the imaginary city - in the first 1 km.
Table 6: Made up land values ($ per sqm)
Years
| ||||||||
distance
|
0-25
|
25-50
|
50-75
|
75-100
|
100-125
|
125-150
|
150-175
|
175-200
|
1
|
$200
|
$260
|
$340
|
$440
|
$570
|
$740
|
$960
|
$1250
|
2
|
$220
|
$290
|
$380
|
$490
|
$640
|
$830
|
$1080
| |
3
|
$237
|
$310
|
$400
|
$520
|
$680
|
$880
| ||
4
|
$248
|
$320
|
$420
|
$550
|
$720
| |||
5
|
$255
|
$330
|
$430
|
$560
| ||||
6
|
$257
|
$330
|
$430
| |||||
If it is then assumed, for the sake of simplicity, that each $100 of land value equals 1 floor on a building, then you might assume that by to 8th period, with the city getting about 200 years old, then the city's height profile might look like this:
Figure 1: Building height based on land value profile
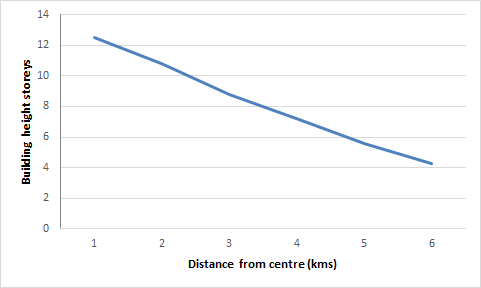
I know this is not a very realistic profile, as usually there is a steep drop off of land values (and hence building height) close to the centre, then a more gentle decline thereafter. However, again it is more the concept which is important.
If we take into account age of buildings and likelihood of redevelopment then we are more likely to get a pattern like this for the 8th time period.
Figure 2: Building height based on land value and age
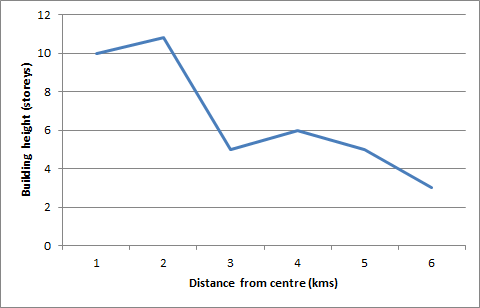
This is because building height is determined by the land values at the start of the building’s life, and depending upon the sequence of growth, ageing then redevelopment; the highest land values may not be in the area with building stock ready to be redeveloped.
The above graph is based on the following figures, which are of the assumed number of storeys. Average building height is constant for three, 25 year periods reflecting the assumed life of a building being 75 years, with that height based on the made up land values in Table 6 in the first 25 year period.
Table 7: Assumed height of buildings
years
| ||||||||
distance
|
0-25
|
25-50
|
50-75
|
75-100
|
100-125
|
125-150
|
150-175
|
175-200
|
3
|
2
|
2
|
2
|
4
|
4
|
4
|
10
|
10
|
6
|
2
|
2
|
2
|
5
|
5
|
5
|
11
| |
9
|
2
|
2
|
2
|
5
|
5
|
5
| ||
12
|
2
|
2
|
2
|
6
|
6
| |||
15
|
3
|
3
|
3
|
5
| ||||
18
|
3
|
3
|
3
| |||||
So, is it possible, given the timing of redevelopment pressures, that the building stock on the edge of the CBD is more likely to redevelop than the stock within the CBD?
Certainly if we look at the Auckland CBD, after a period during which a lot of building development occurred down along the waterfront area, there are signs of building activity occurring in the mid CBD area, with some very tall towers now proposed close to the mid town Aotea area.
Actual land values drop off quickly between the waterfront area of the CBD and the Newton area and so it is unlikely that Newton will see taller buildings than downtown. Having said that, CRL is likely to see some dispersal of office based activities to edge of CBD areas as the upgraded rail system modifies accessibility profiles. Time to re look at building heights in places with high land values and older building stock?
Actual land values drop off quickly between the waterfront area of the CBD and the Newton area and so it is unlikely that Newton will see taller buildings than downtown. Having said that, CRL is likely to see some dispersal of office based activities to edge of CBD areas as the upgraded rail system modifies accessibility profiles. Time to re look at building heights in places with high land values and older building stock?
Perhaps the more interesting question is the extent to which the above patterns of age of buildings and land values may influence patterns of redevelopment in residential areas. Capital (houses) can be very durable if there are strong emotional values attached to houses, for example, while often redevelopment is slowed not by the age of buildings, but by the fragmentation of land.